Effective storytelling is a vital component in the presentation of research findings, particularly when addressing stakeholders who may lack a deep understanding of customer pain points and needs. The objective is to craft narratives that guide the audience through the research journey, fostering empathy and comprehension of customer experiences. By employing storytelling techniques, such as journey maps, user flows, flow charts, and process maps, researchers can effectively convey insights and illuminate the intricacies of user interactions and behaviors. These tools serve as visual aids that bring research findings to life, enabling stakeholders to grasp the significance of customer-centric perspectives and make informed decisions based on empathy and understanding.
🗺 Journey maps
Journey maps can be utilised in many different ways to either outline a customer journey and touchpoint, a service provided by an organisation or events that have different touch points with products or personas. The variations of a journey map depend on what needs to be communicated.
In the discovery phase of a project a journey map can highlight touch points, pain points, emotions, behaviours or tasks. A lot of work and creative thinking goes into creating a journey map. A well designed end product is the result of understanding the research data, sorting the categories and swim lanes and making sense of it all.
I typically used all the wall space and white boards in the office and used post-it notes to organise my thinking around the customer journey. I had to adjust my way of working with WFH orders and found Miro, an online white boarding software. This tool has been a life saver for running journey map workshops or helping to organise the content into a journey map. I've also used Microsoft Excel to lay out research data before crafting the final product which is my least preferred software to create journey maps.
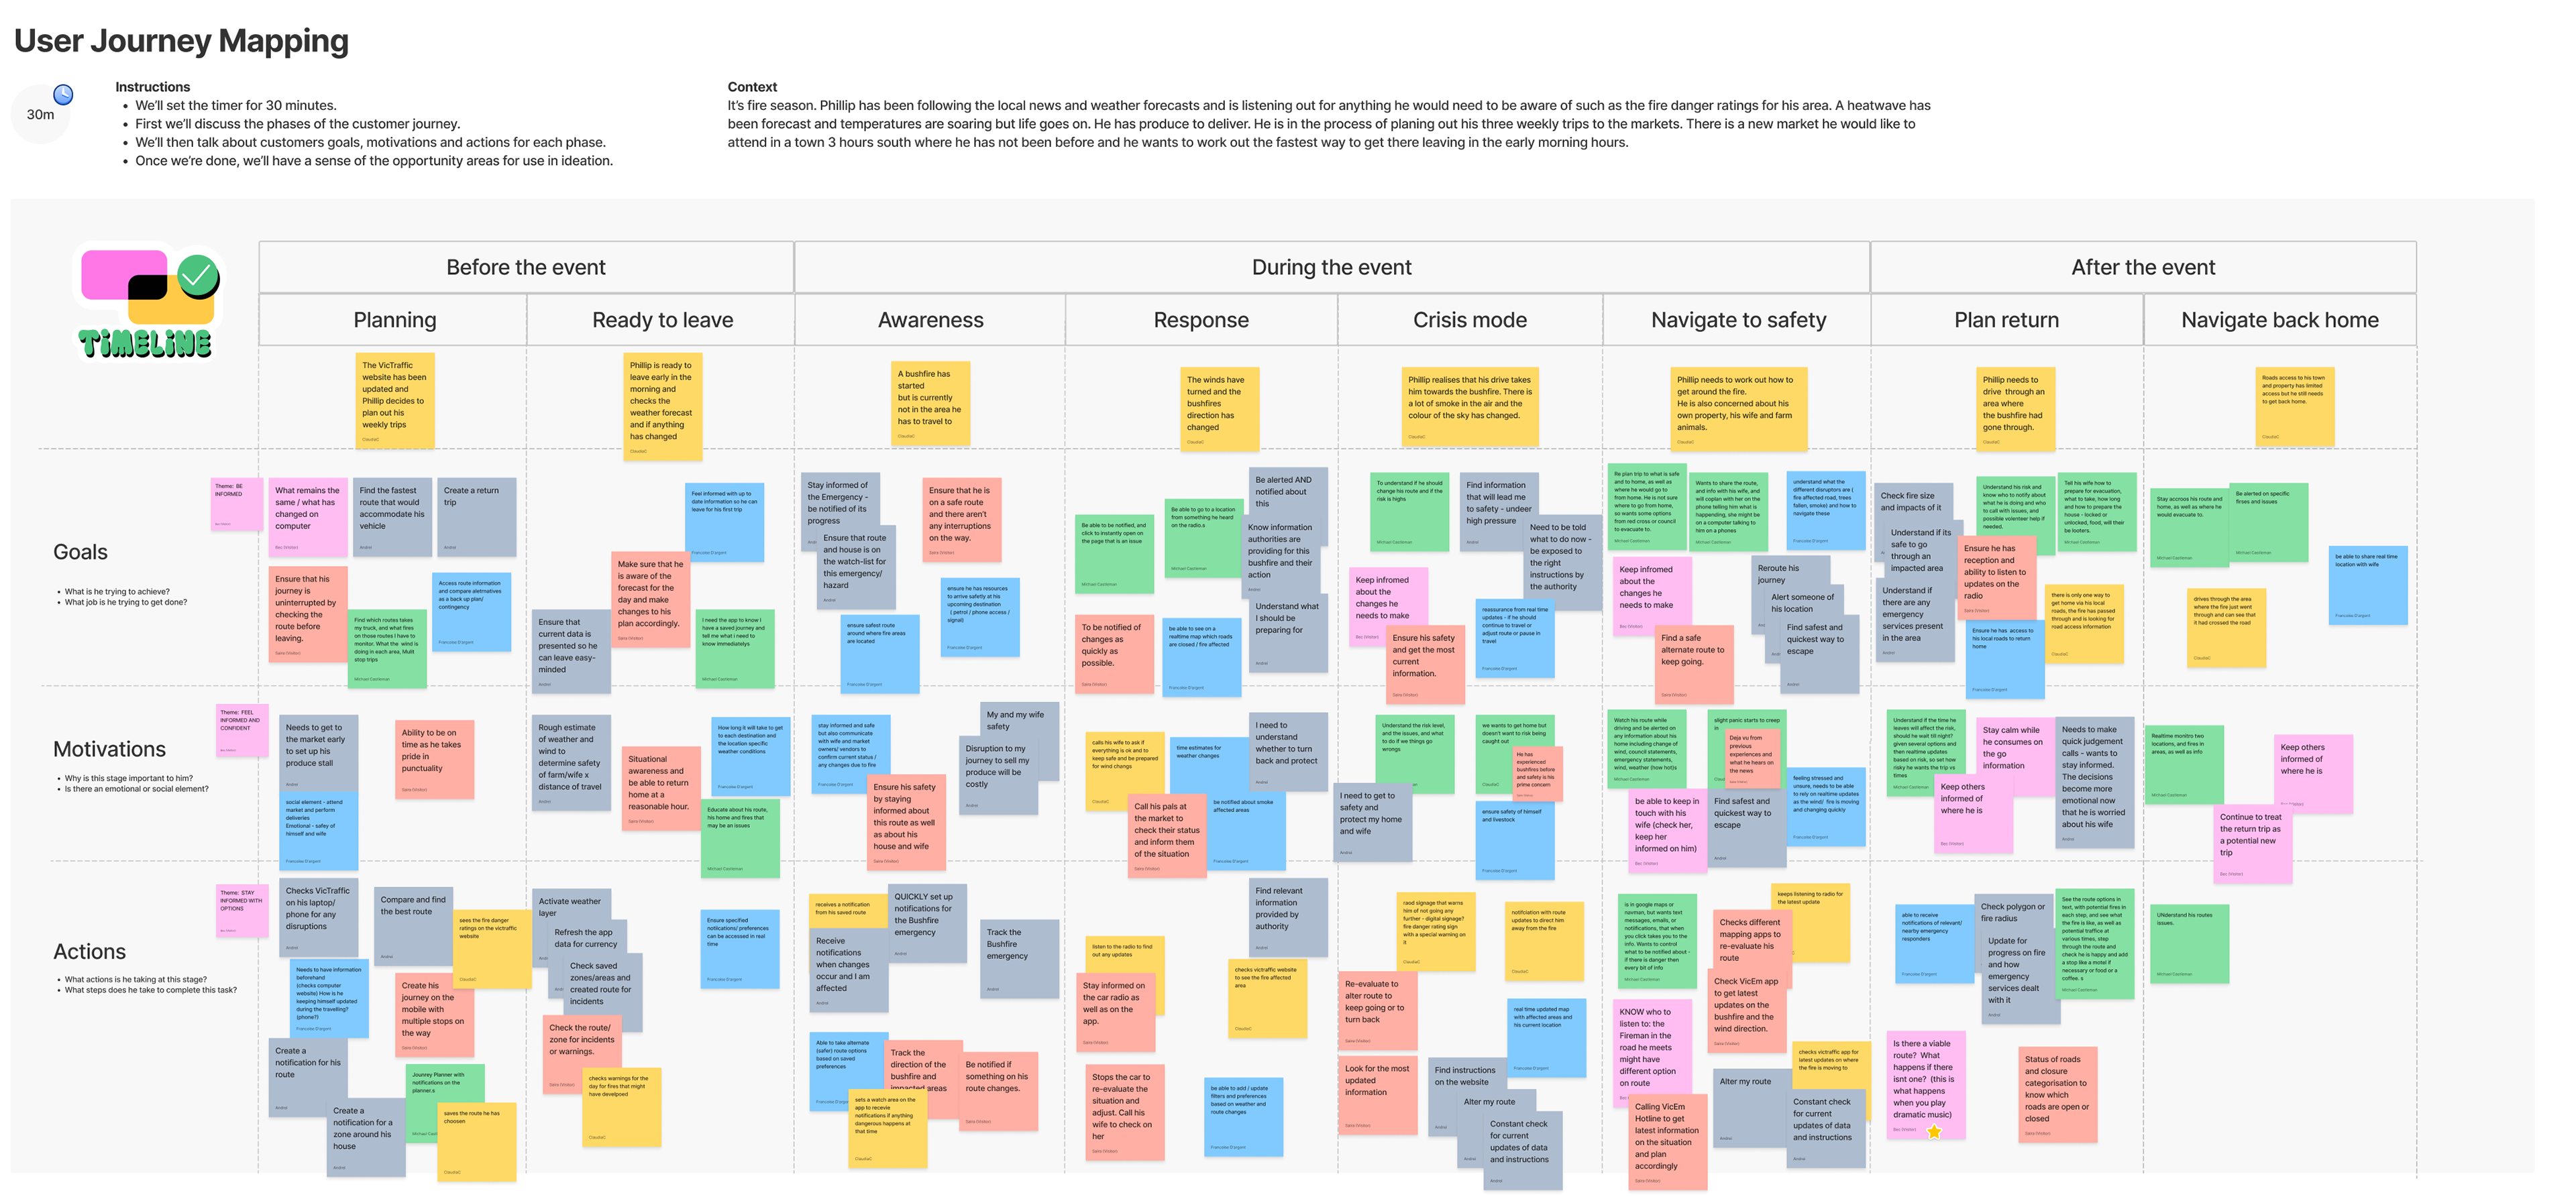
A co-design workshop that produced a journey map for a user who travels weekly to different markets on the Victorian road network. On his journey travelling from point A to point B he has different needs and encounters different paint points. This journey map helped to identify gaps in the VicTraffic product suite and channels.
Other journey maps produced at BOM through a variety of workshops with project team members, stakeholders or SMEs
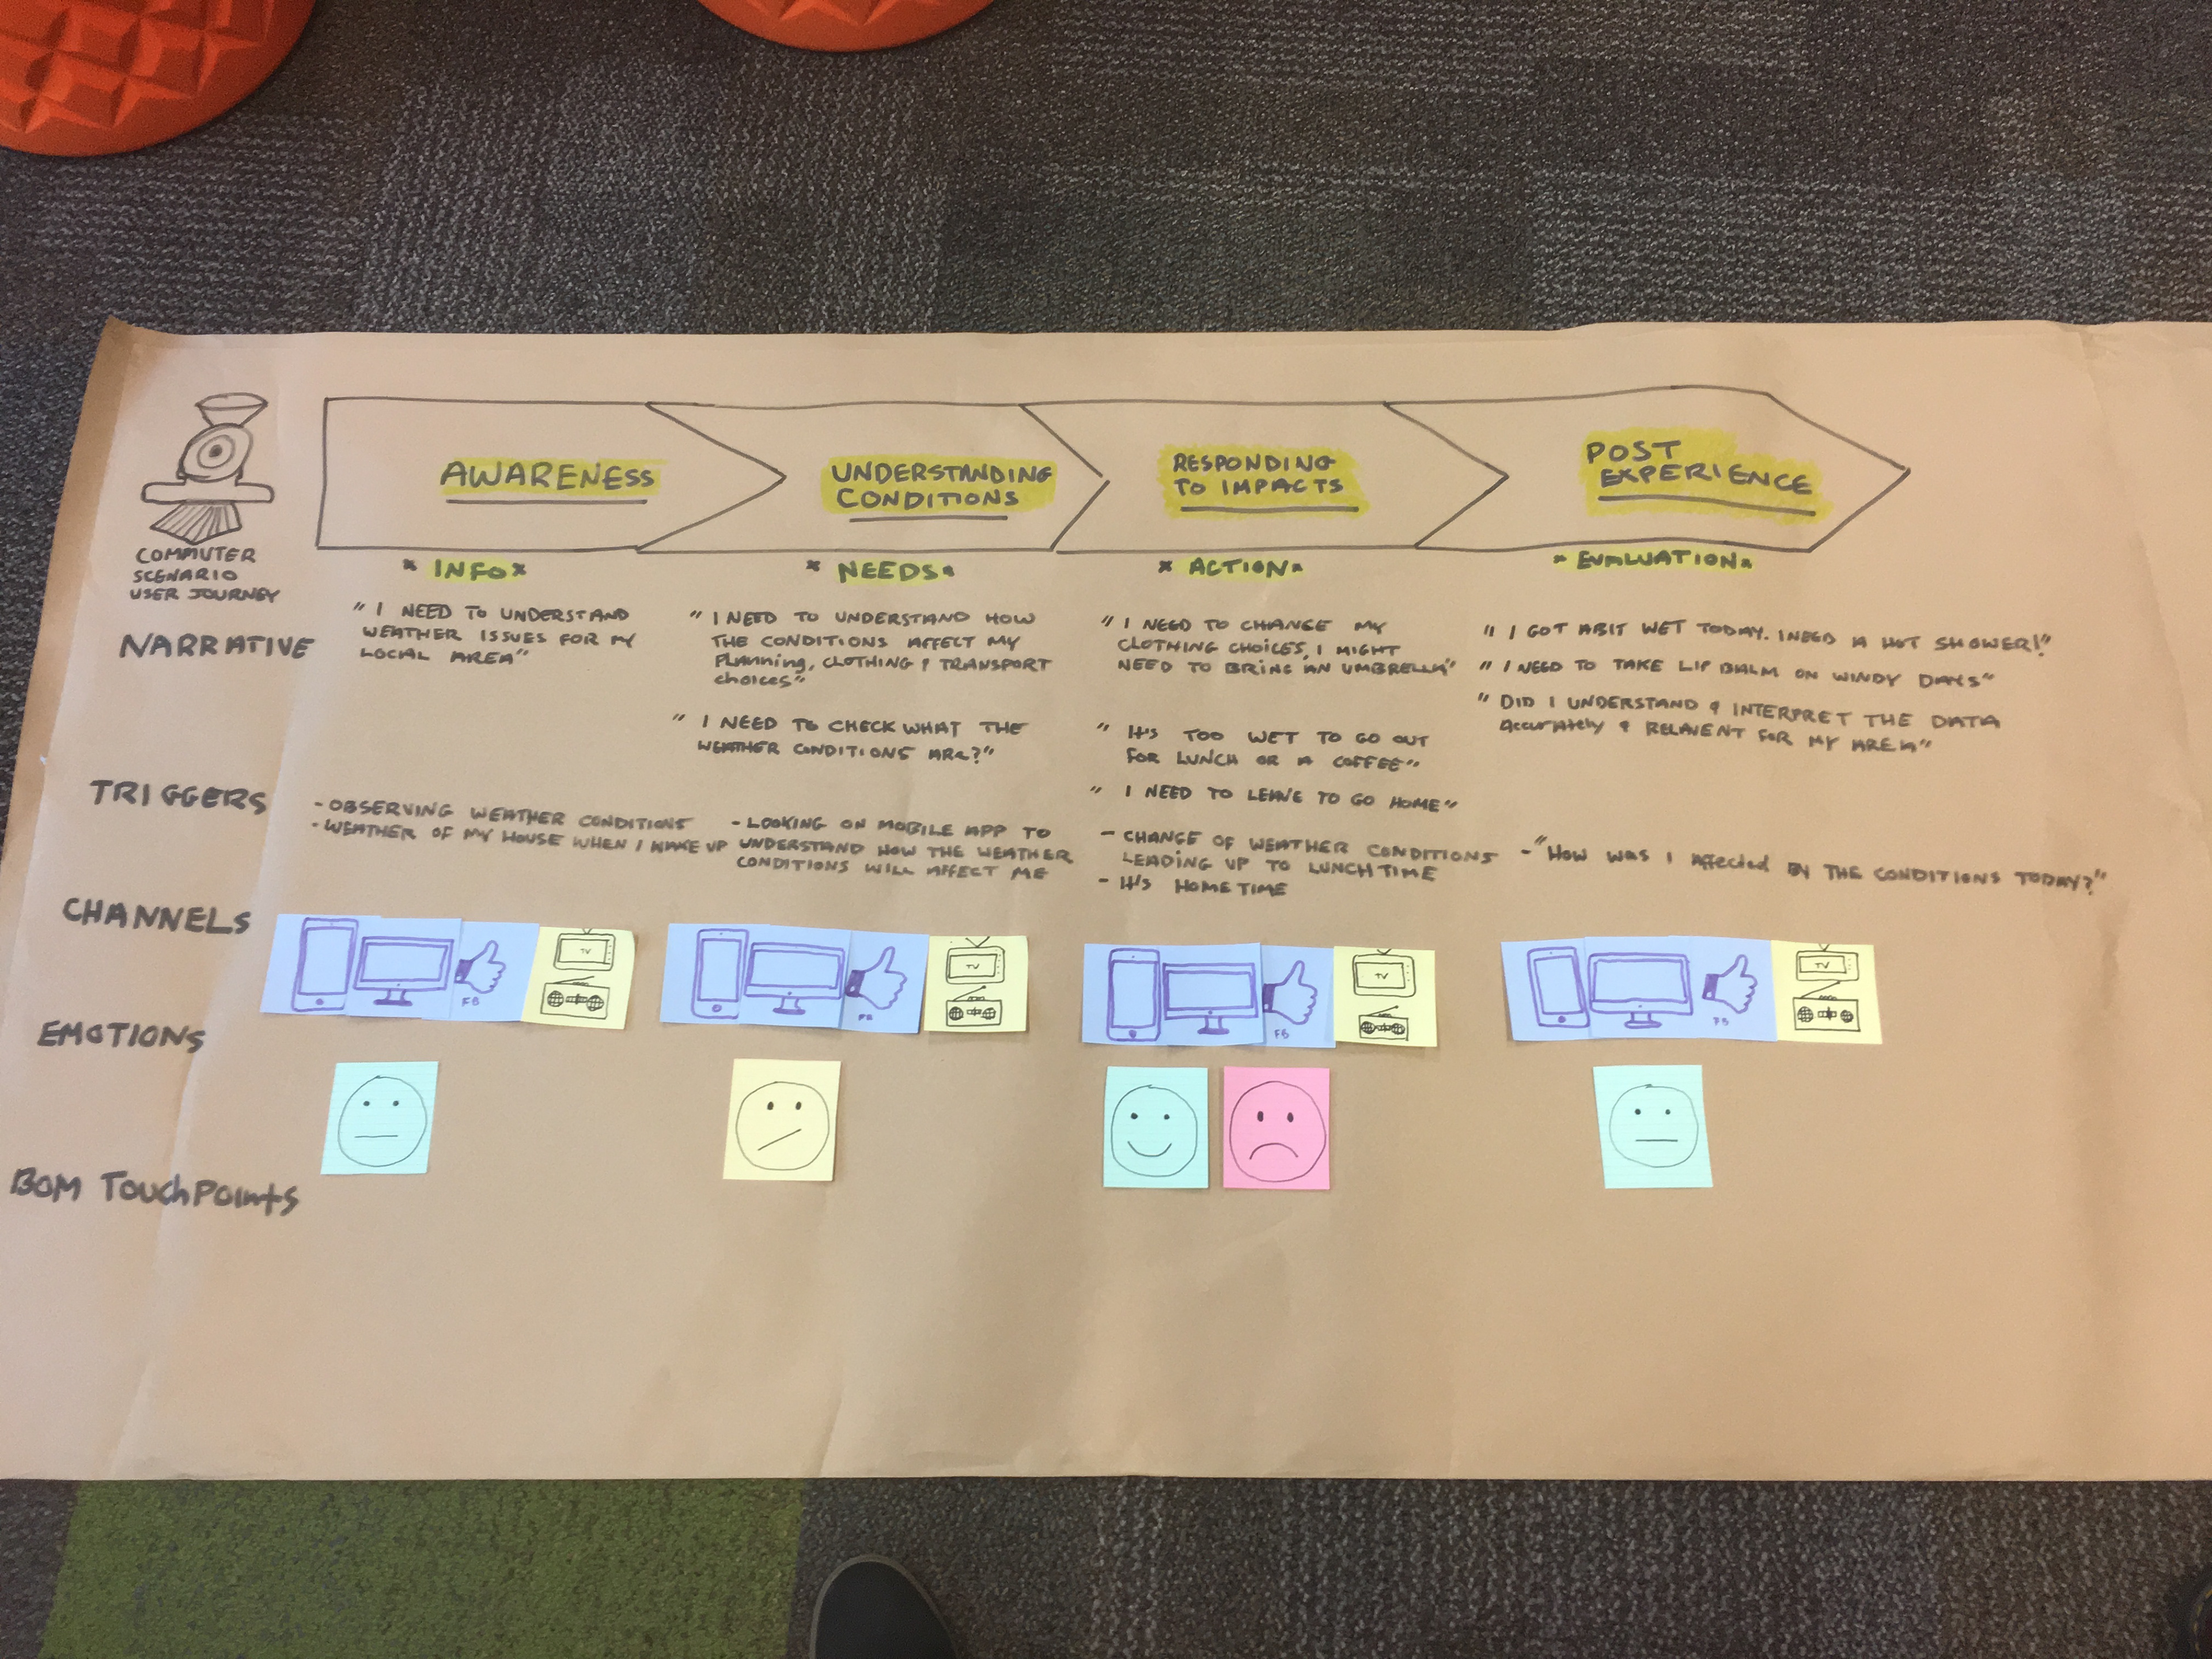
The early stages of a journey map forming
A journey map created with multiple participants in Miro
Another Miro workshop to gather insights for a journey map

Journey map feedback from peers after a design review session
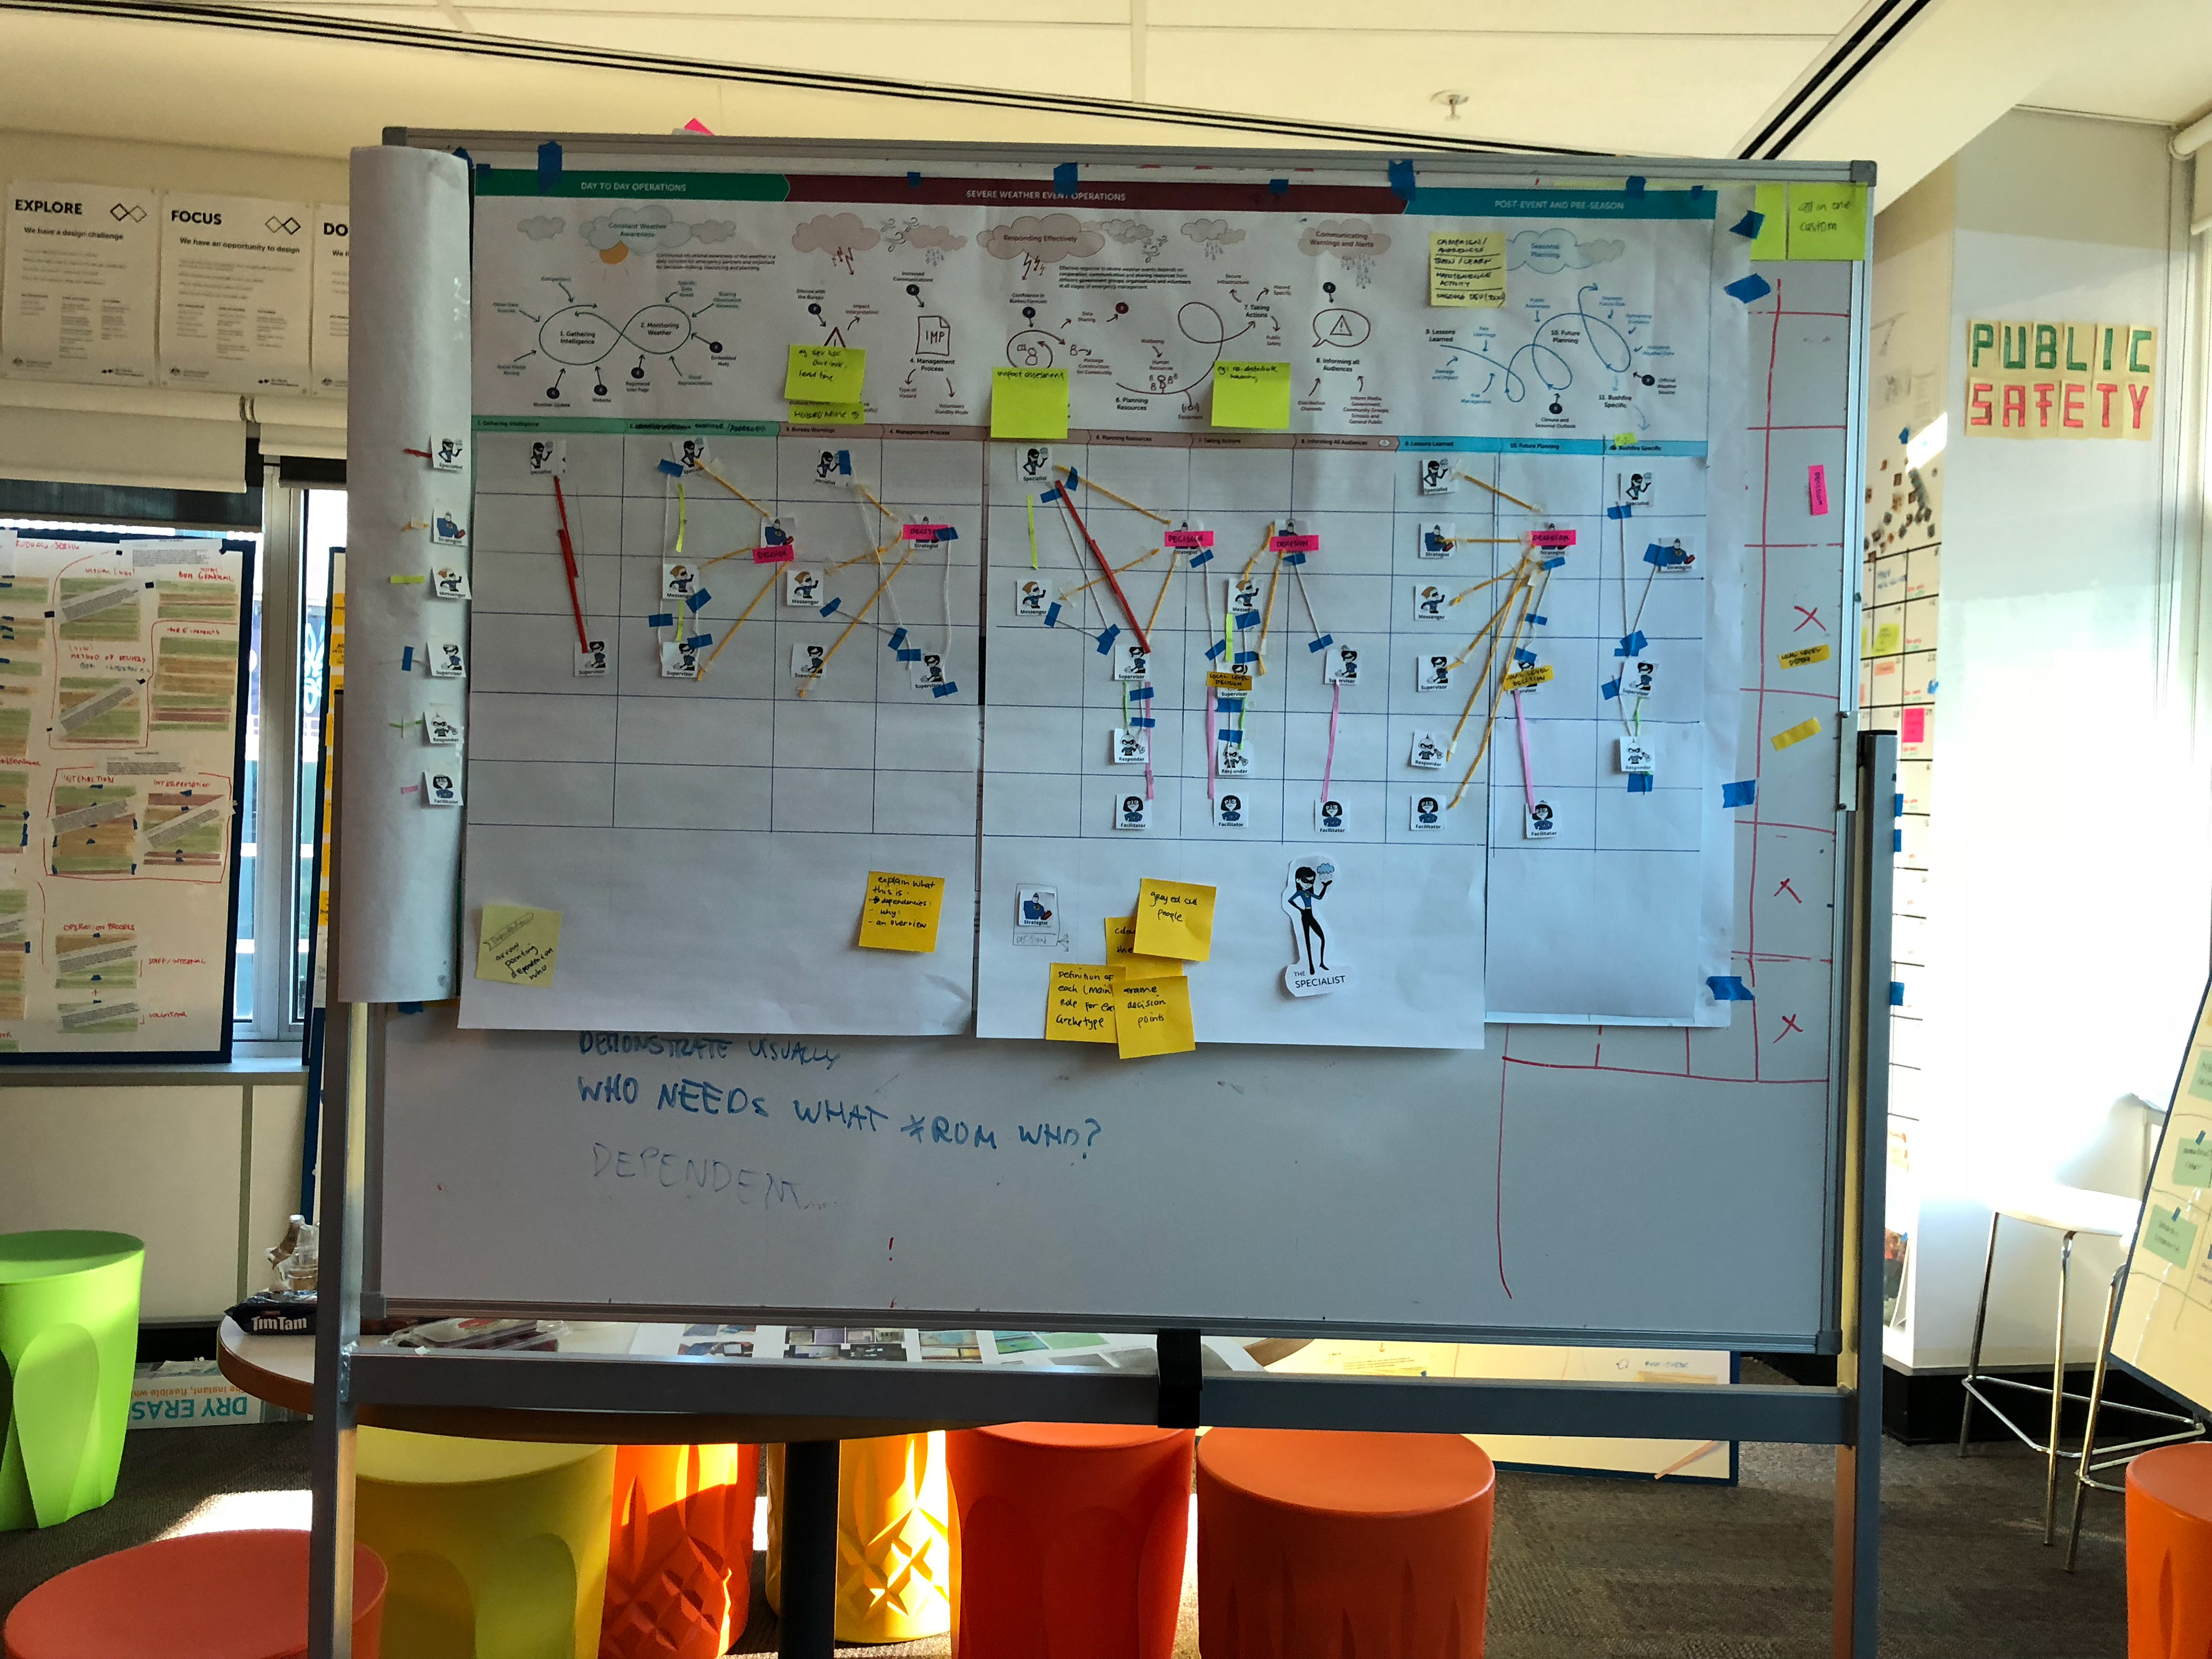
Expanding a journey map into a hybrid dependency chart
An excel spreadsheet populated with research data in preparation for a journey map
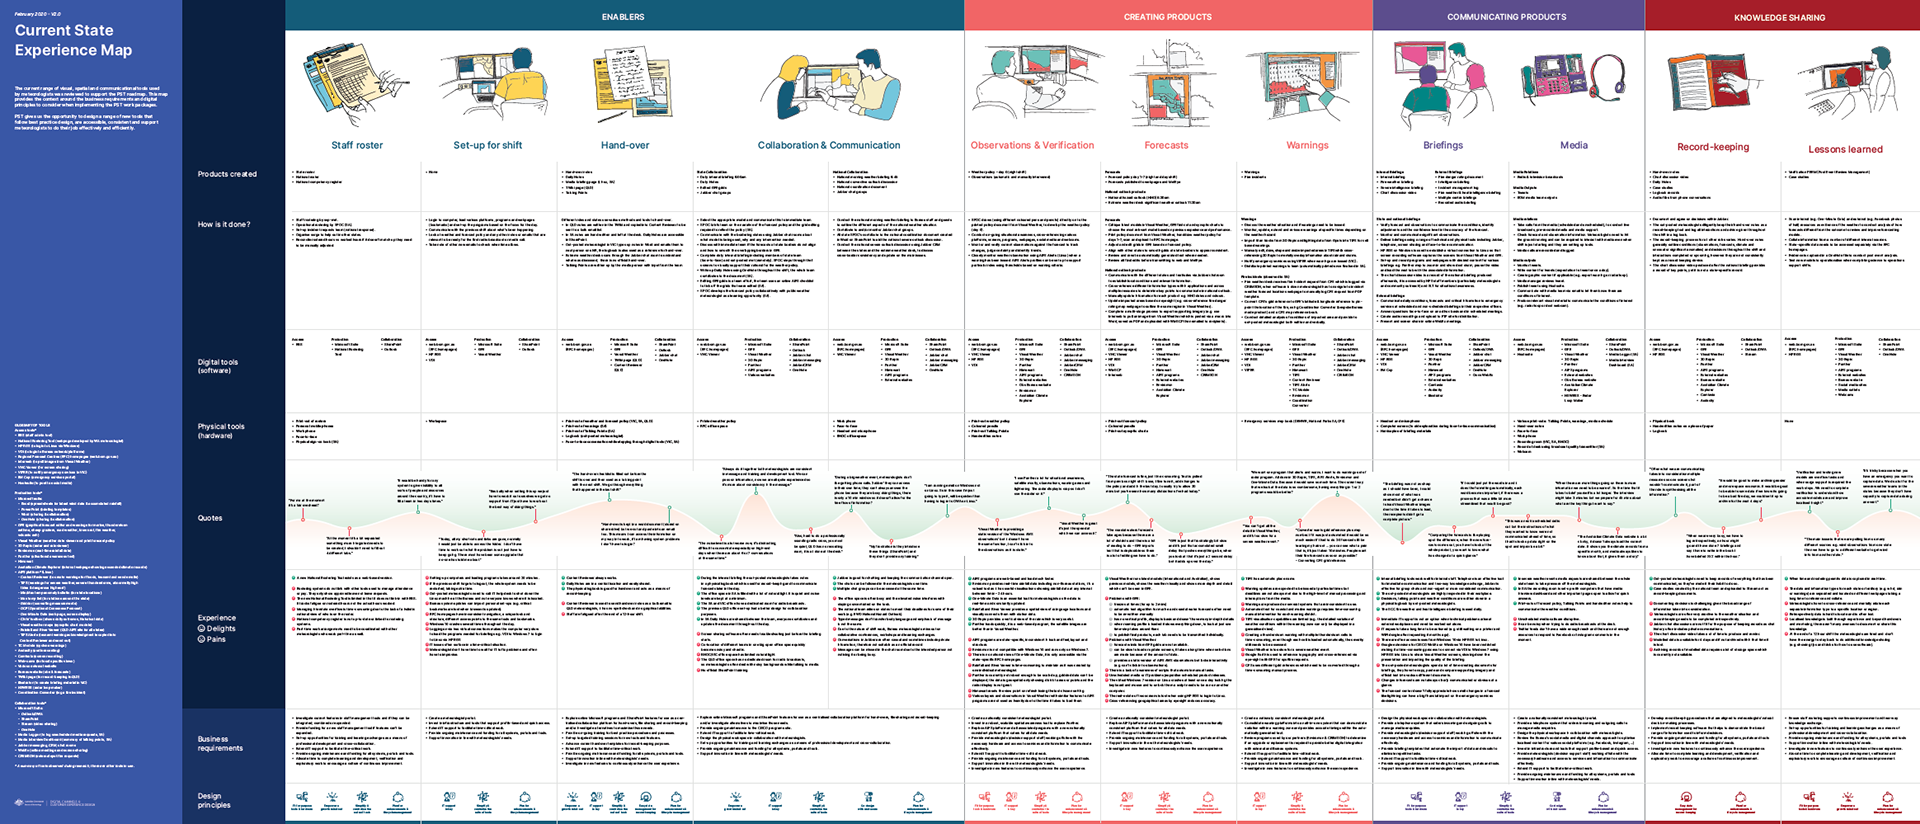
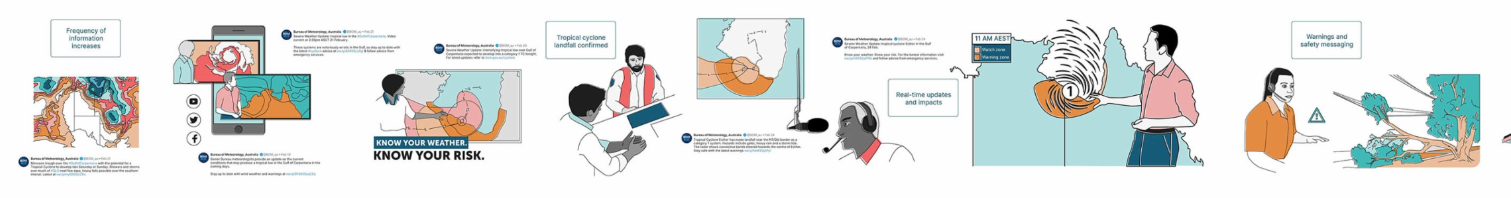
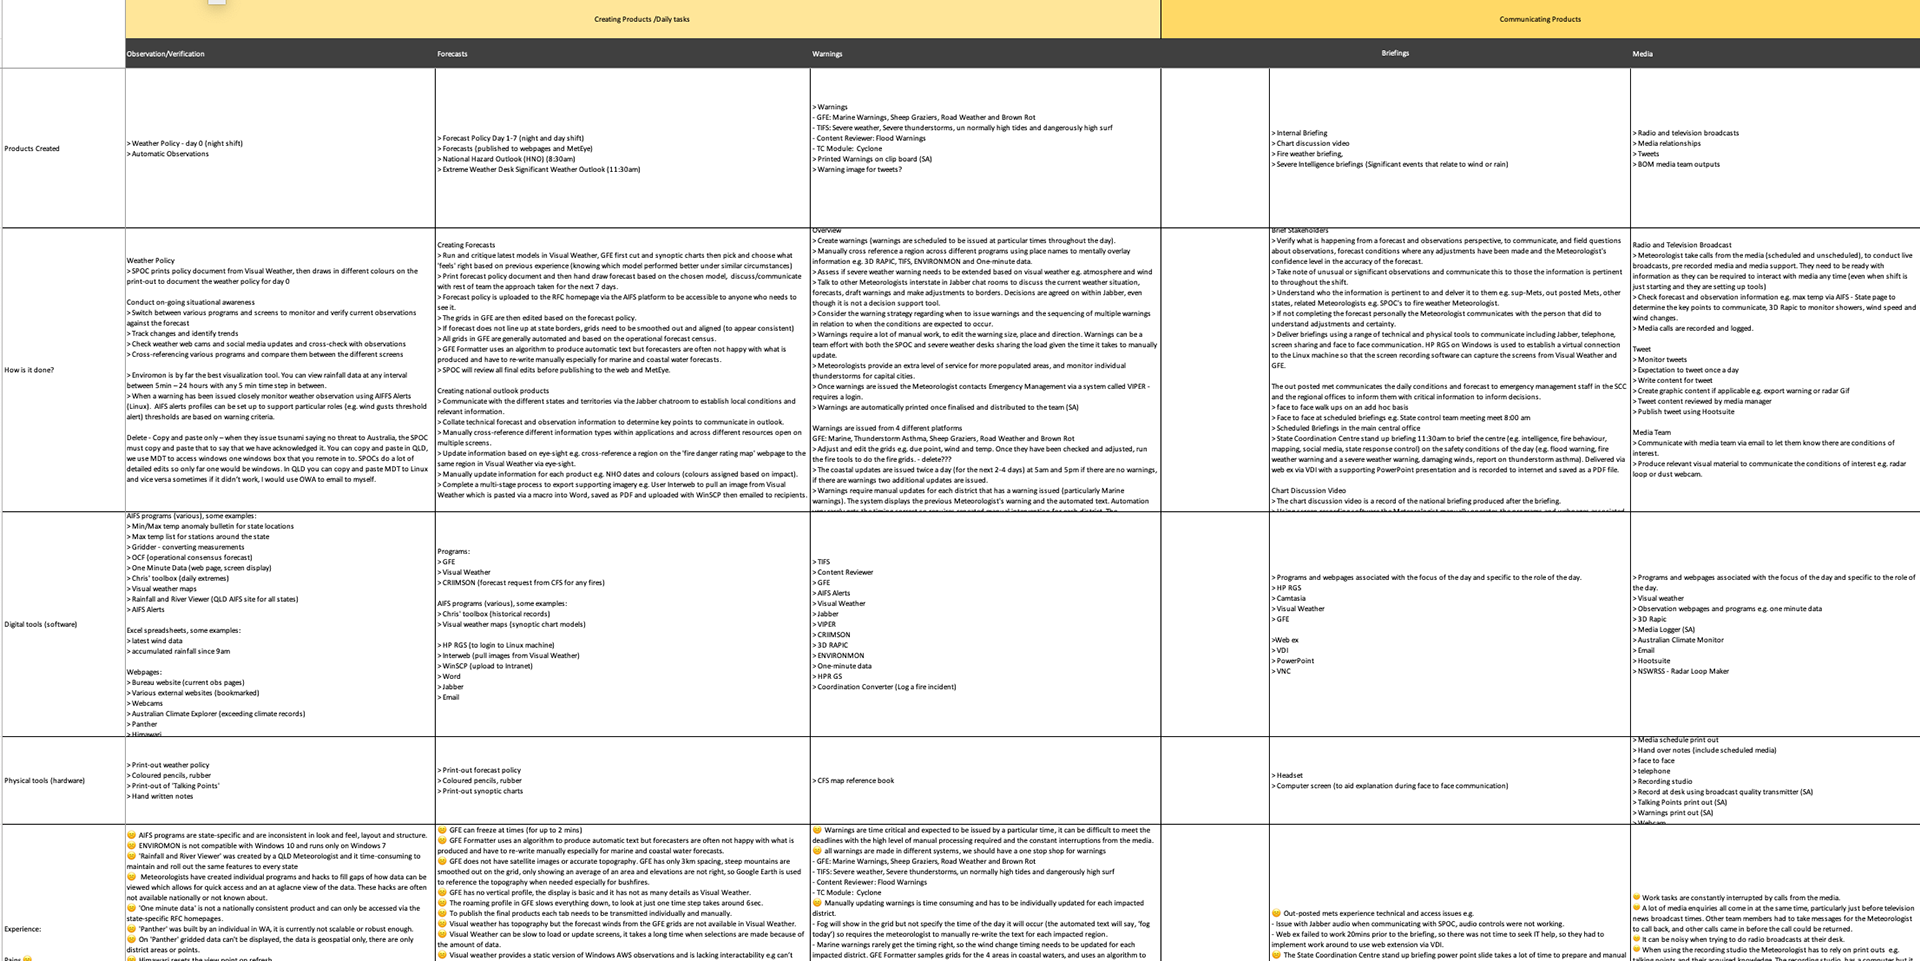
Tools that forecasters use during shift work
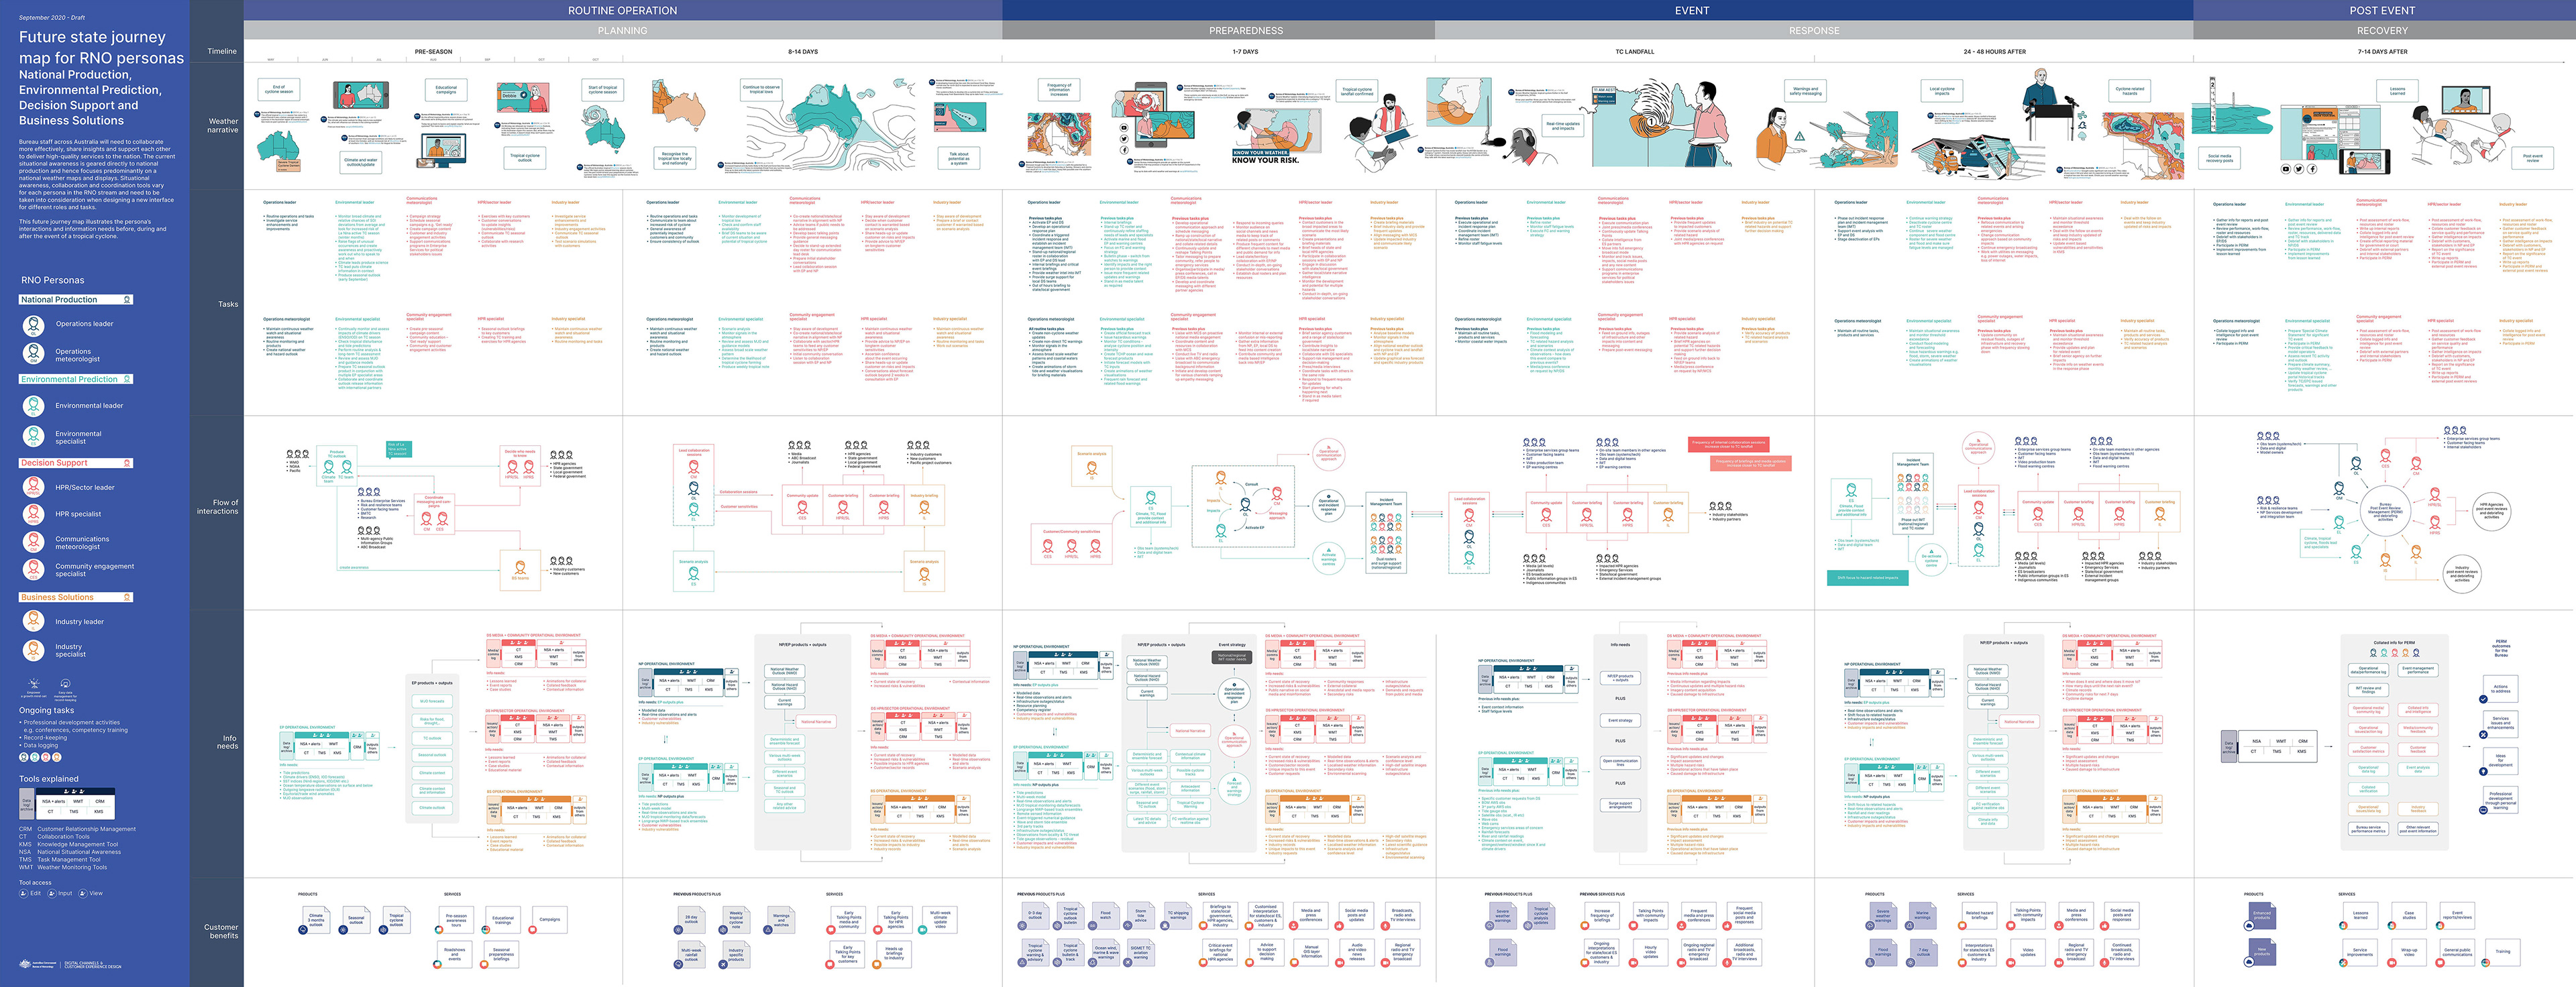
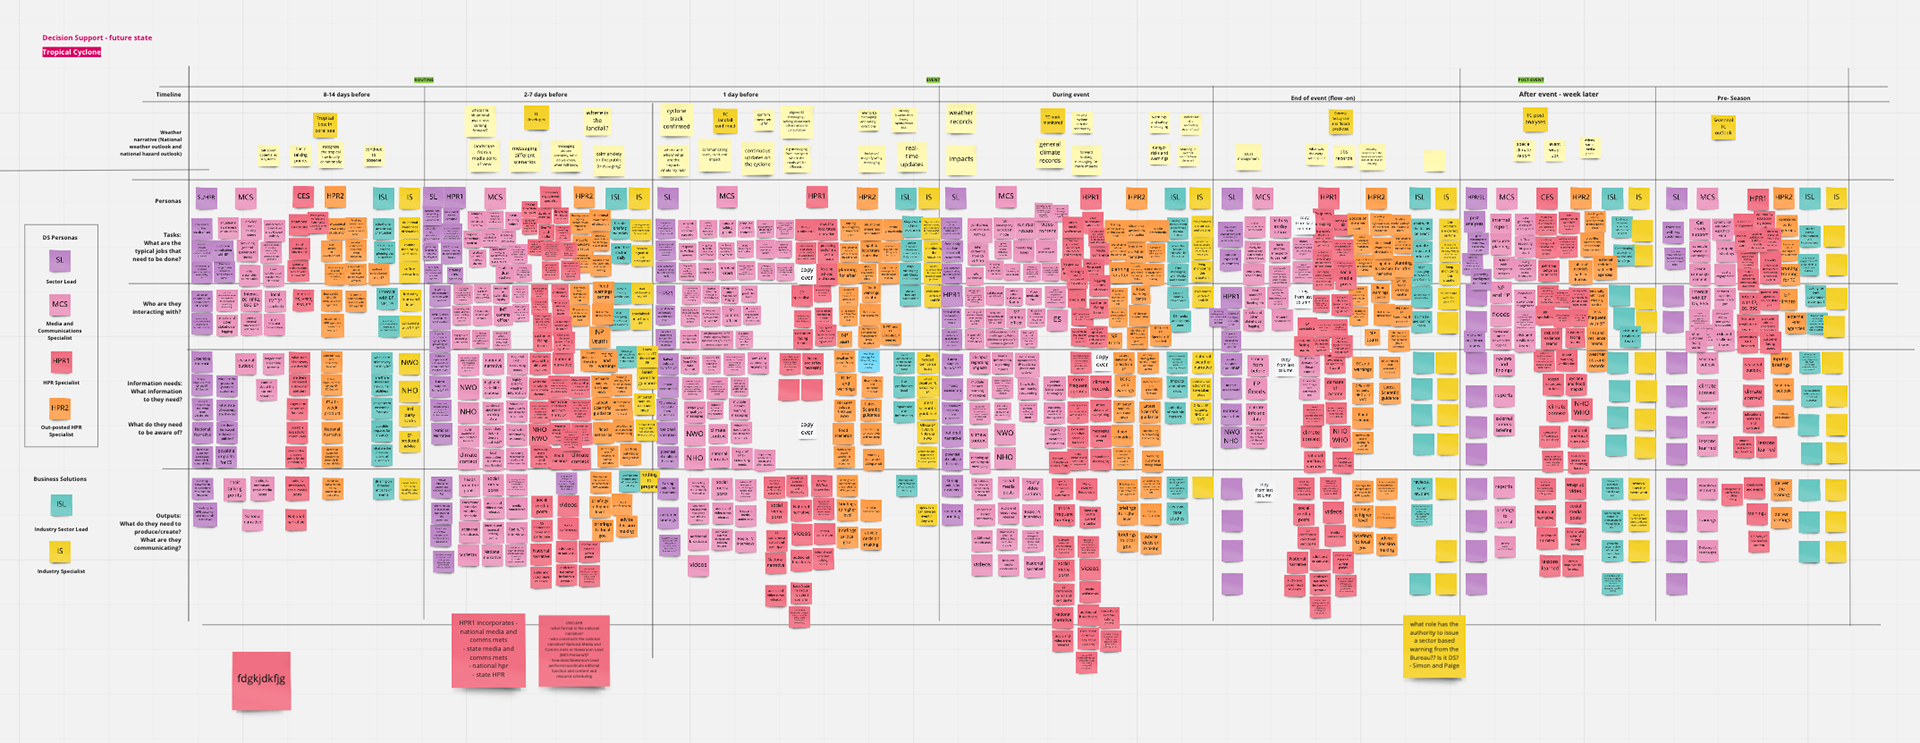
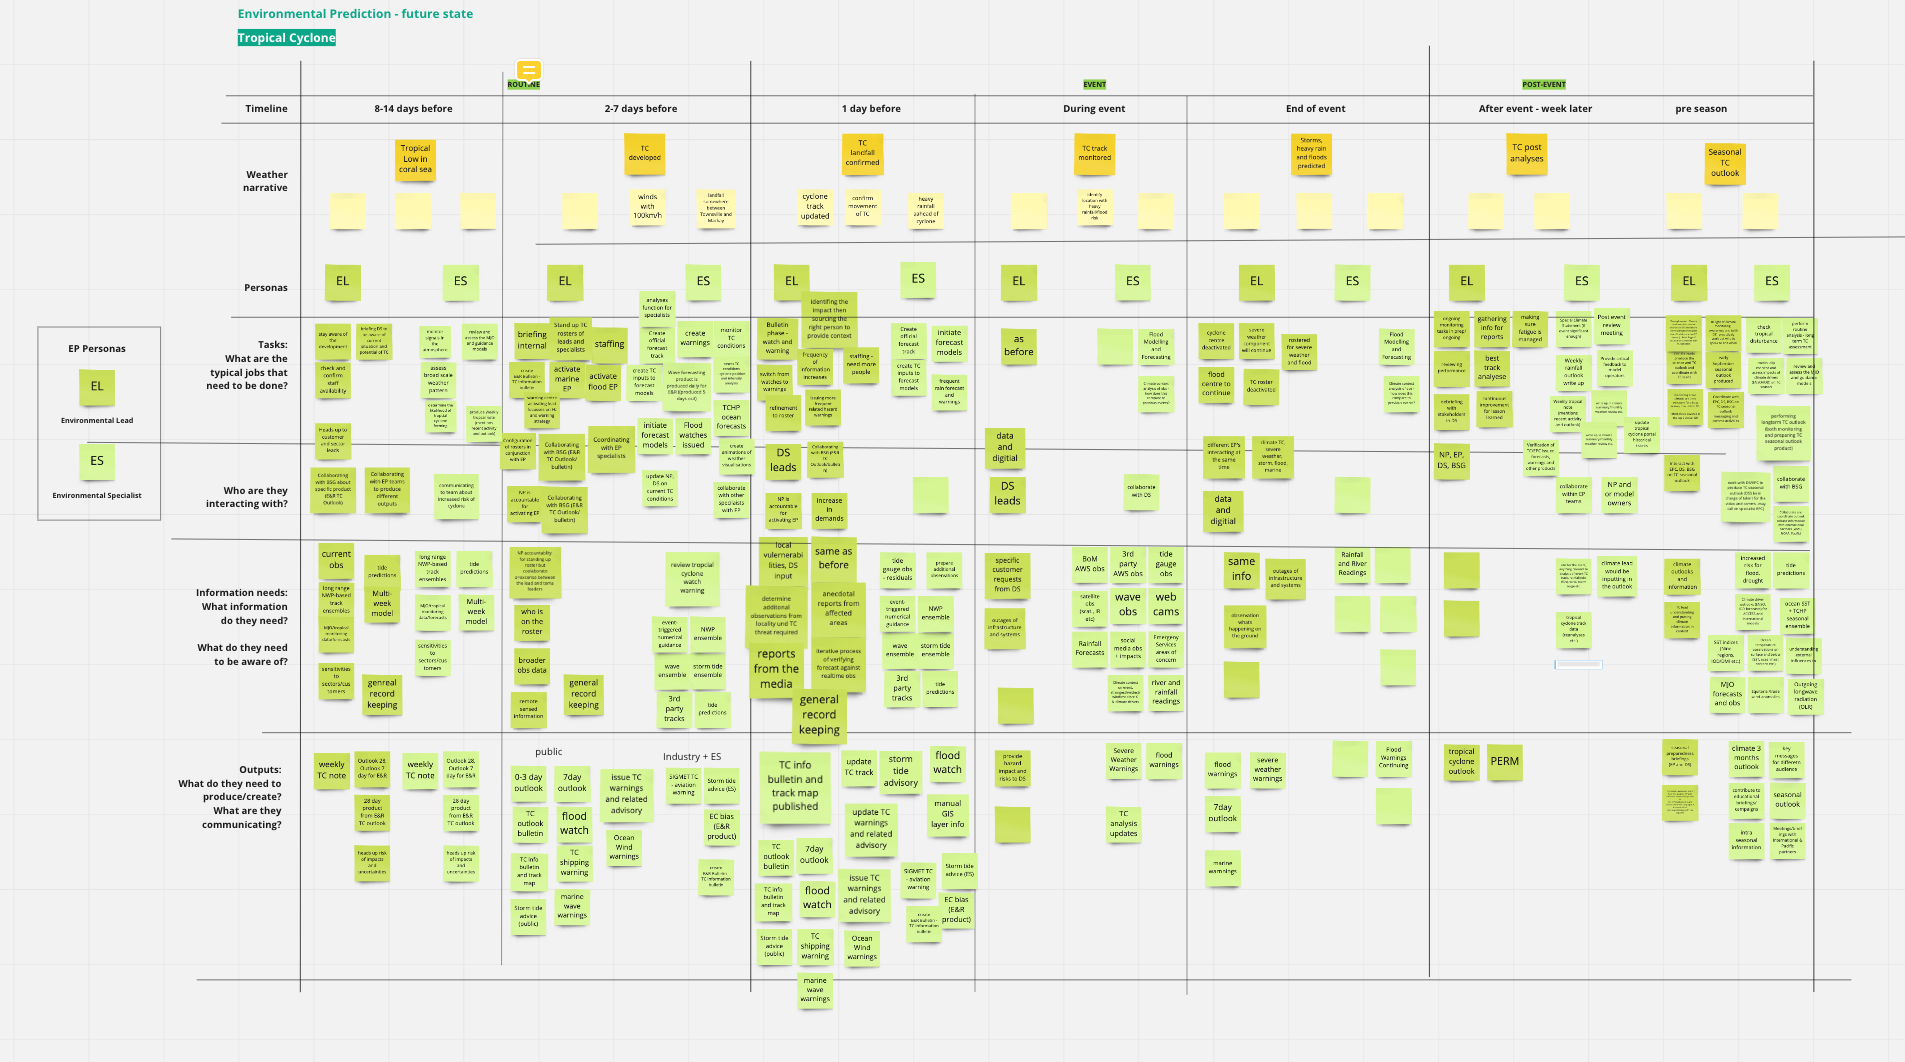
How RNO persona have to interact along a tropical cyclone lifecycle
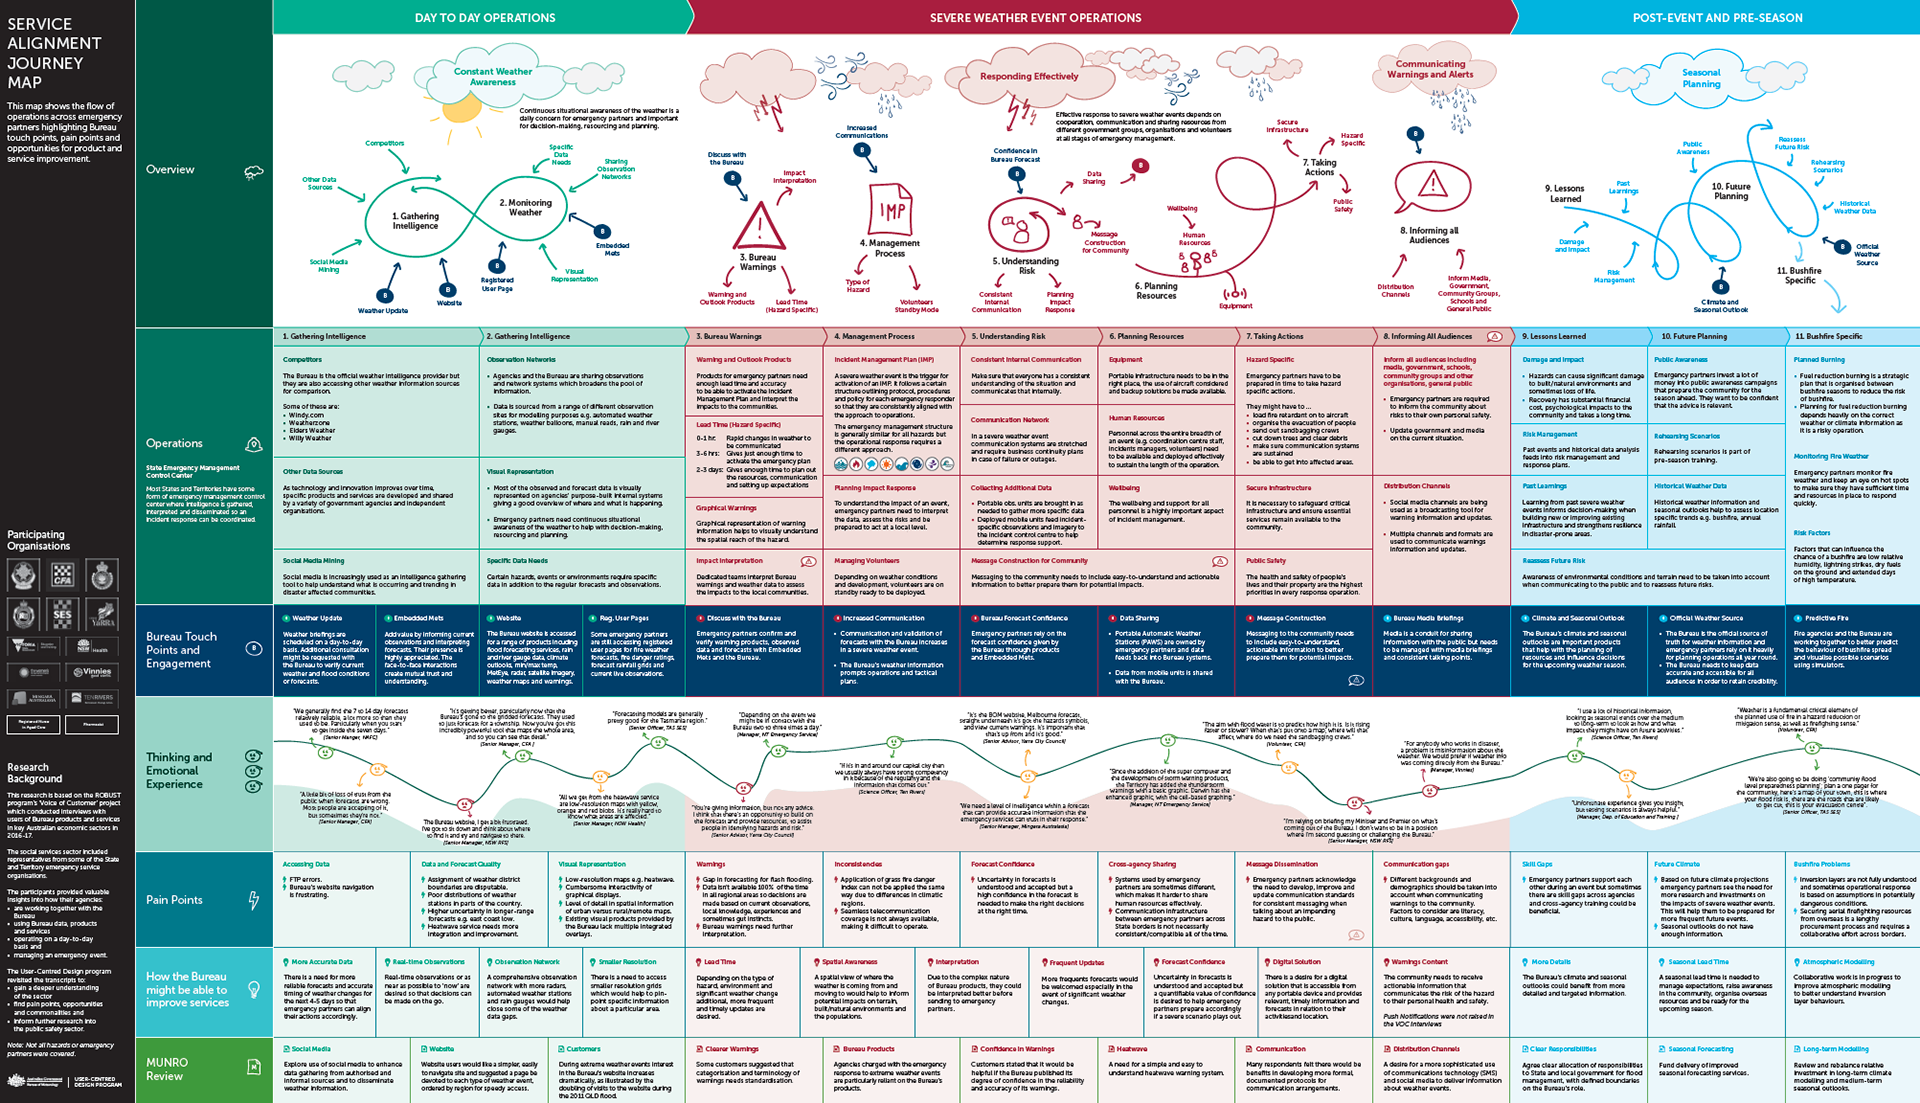
EM and BOM warnings services
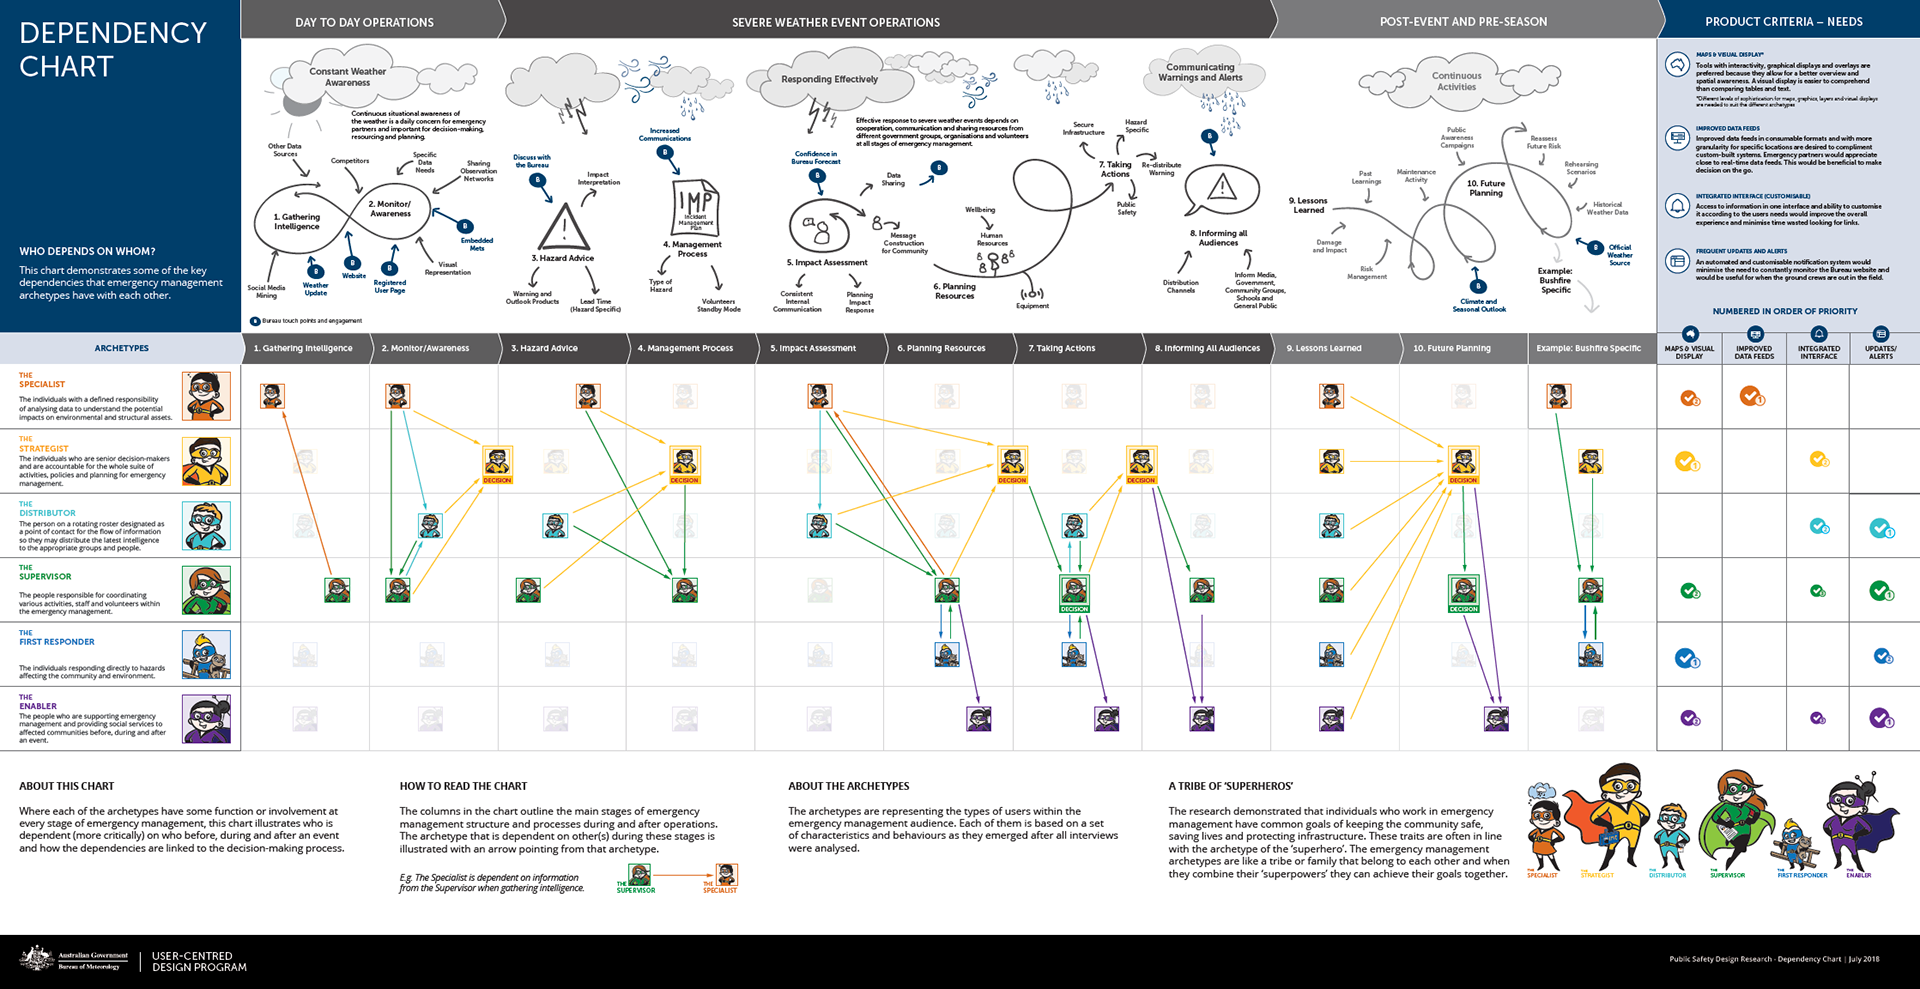
How emergency management personas depend on each other along the weather warning lifecycle
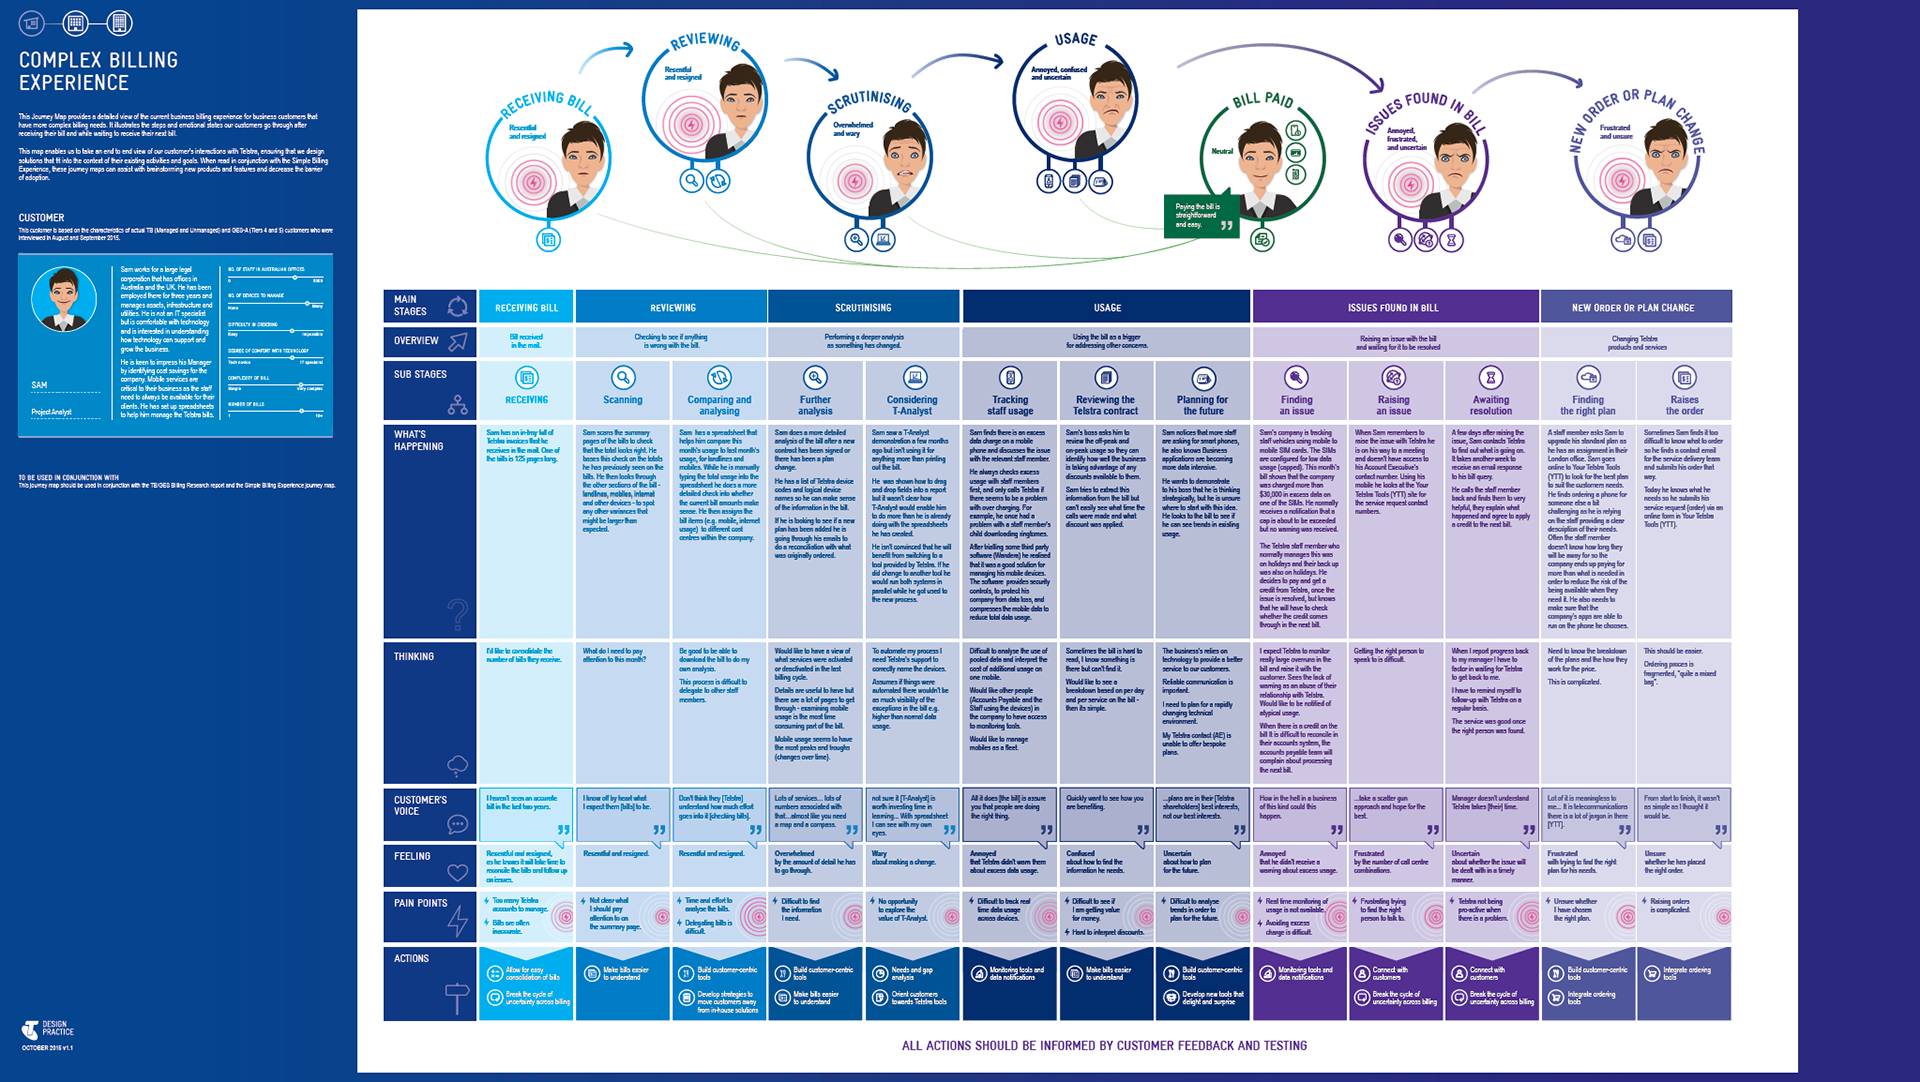
The billing experience for commercial telecommunications customers
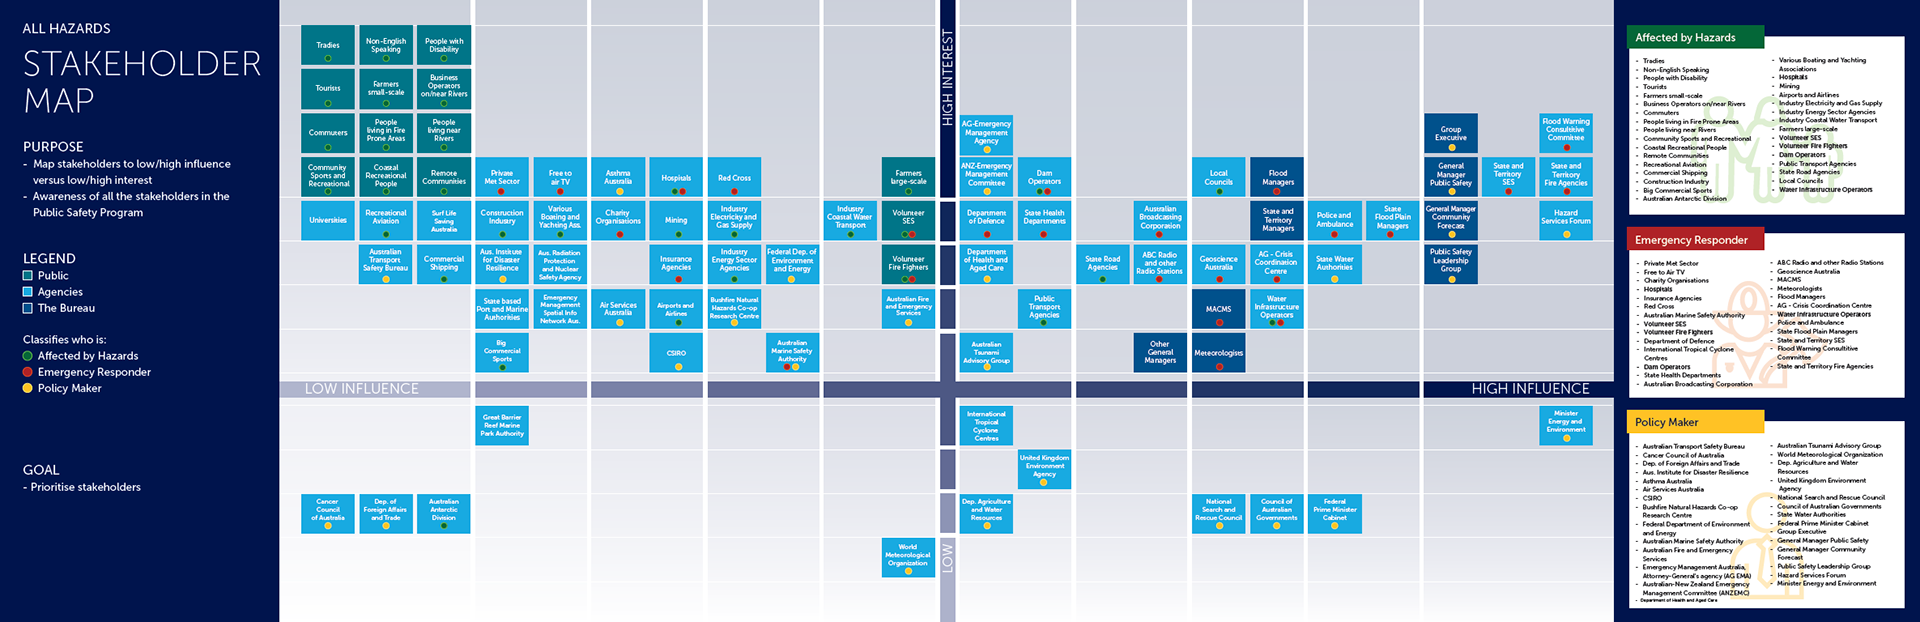
Stakeholder map and their priorities
💻 User flows
User flows serve as indispensable tools in depicting the progression of a user through an interface. By mapping out interactions and potential pathways leading to a desired outcome, user flows delineate the necessary screens required to maintain a seamless flow of information.
Rigorous testing of user flows is essential to unveil any gaps in design thinking and enhance the overall user experience, reinforcing the importance of iterative refinement in crafting intuitive and effective interfaces.
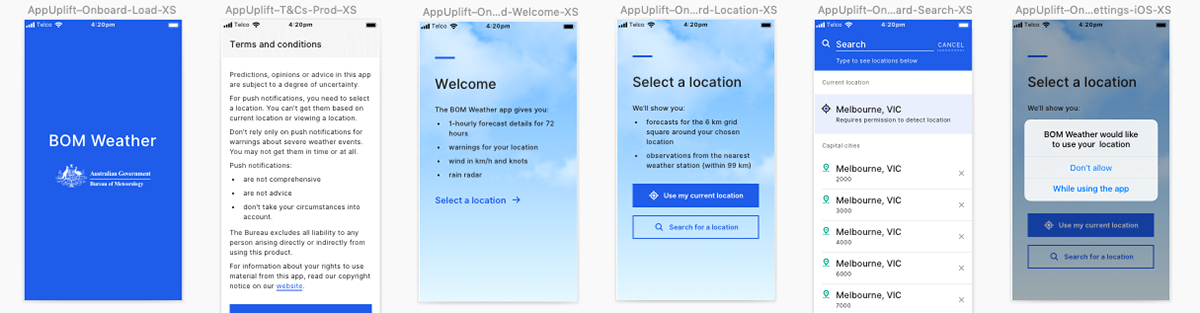
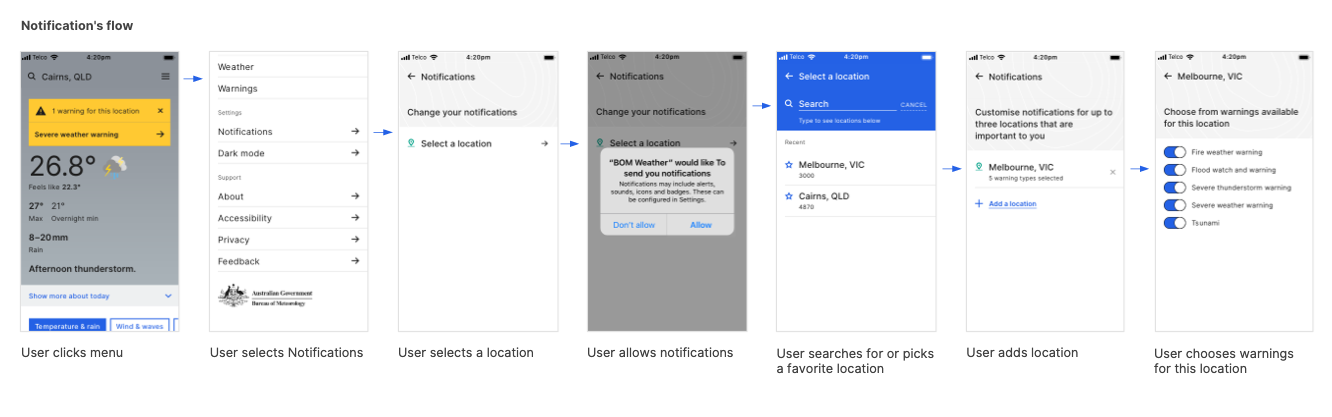
User flow through accessing and enabling notifications in the app
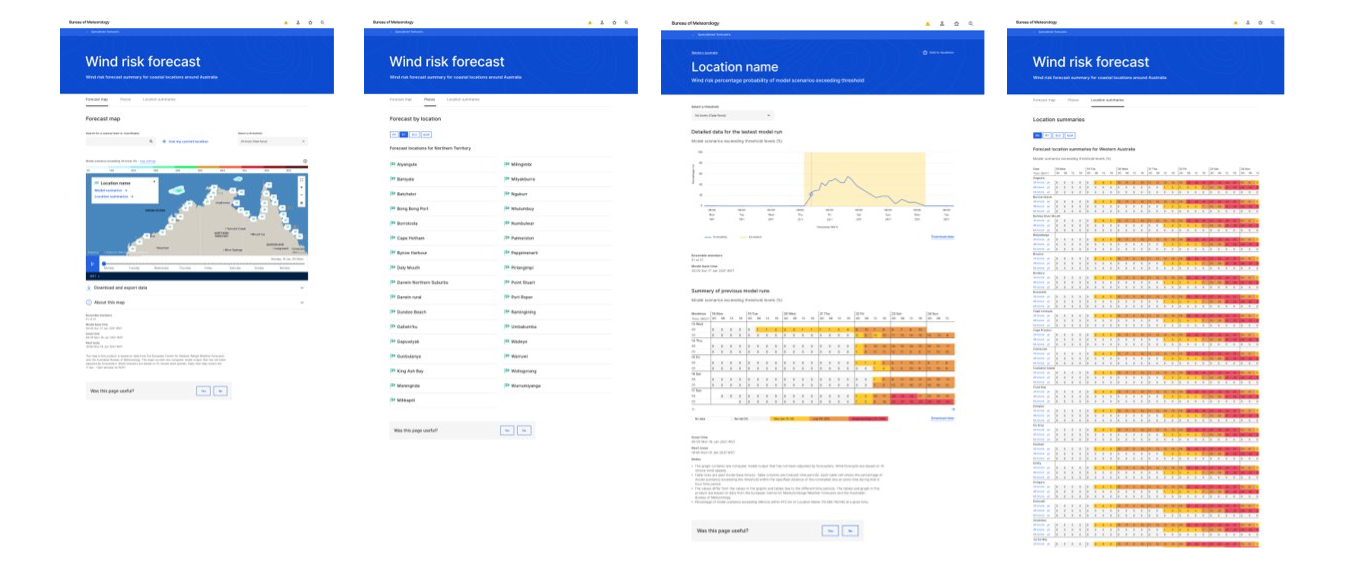
User flow through the wind risk forecast product
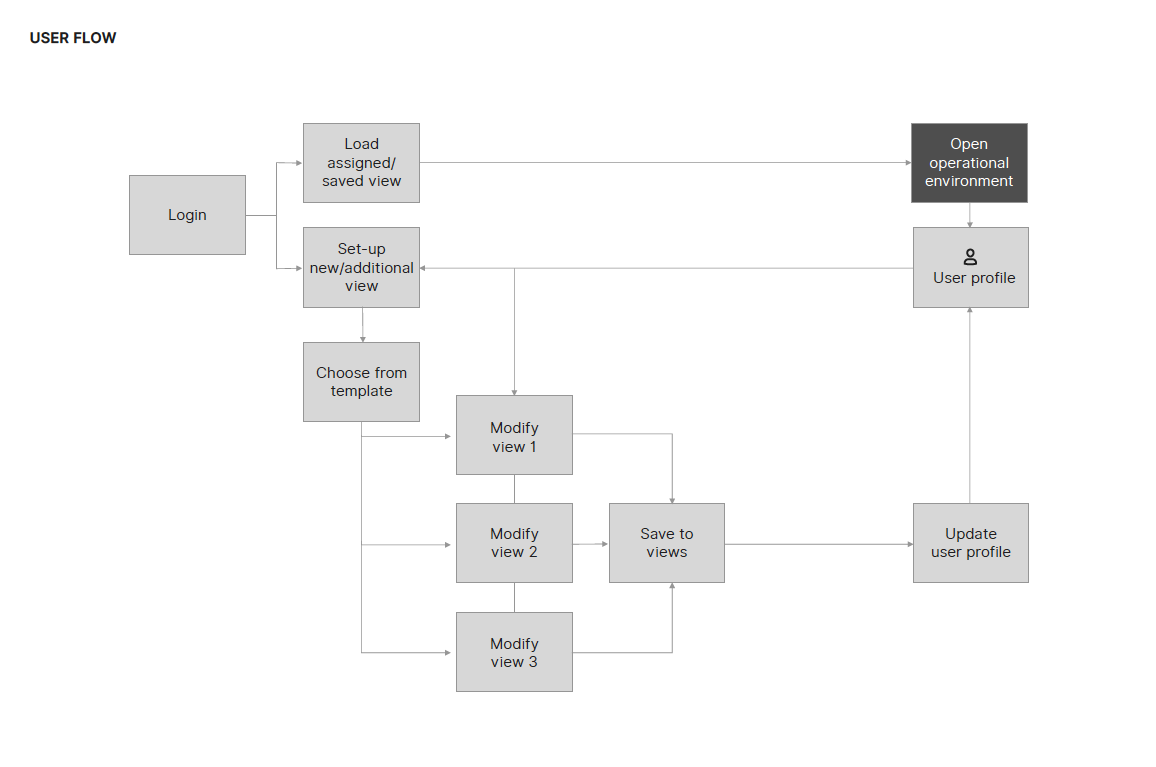
User flow for a situational awareness tool
🗾 Flow charts and process maps
The images below are examples of different types of flow charts and process maps that show how information moves from on person to another or how data moves through the pipeline of a whole ecosystem.
Illustrating these flows helps to visualise where there might be gaps in the system or highlight pain points and bottlenecks. Research helps to draw out the relations between different systems, organisations or people. Flow charts and process maps are a great tool to communicate a current or required future state.
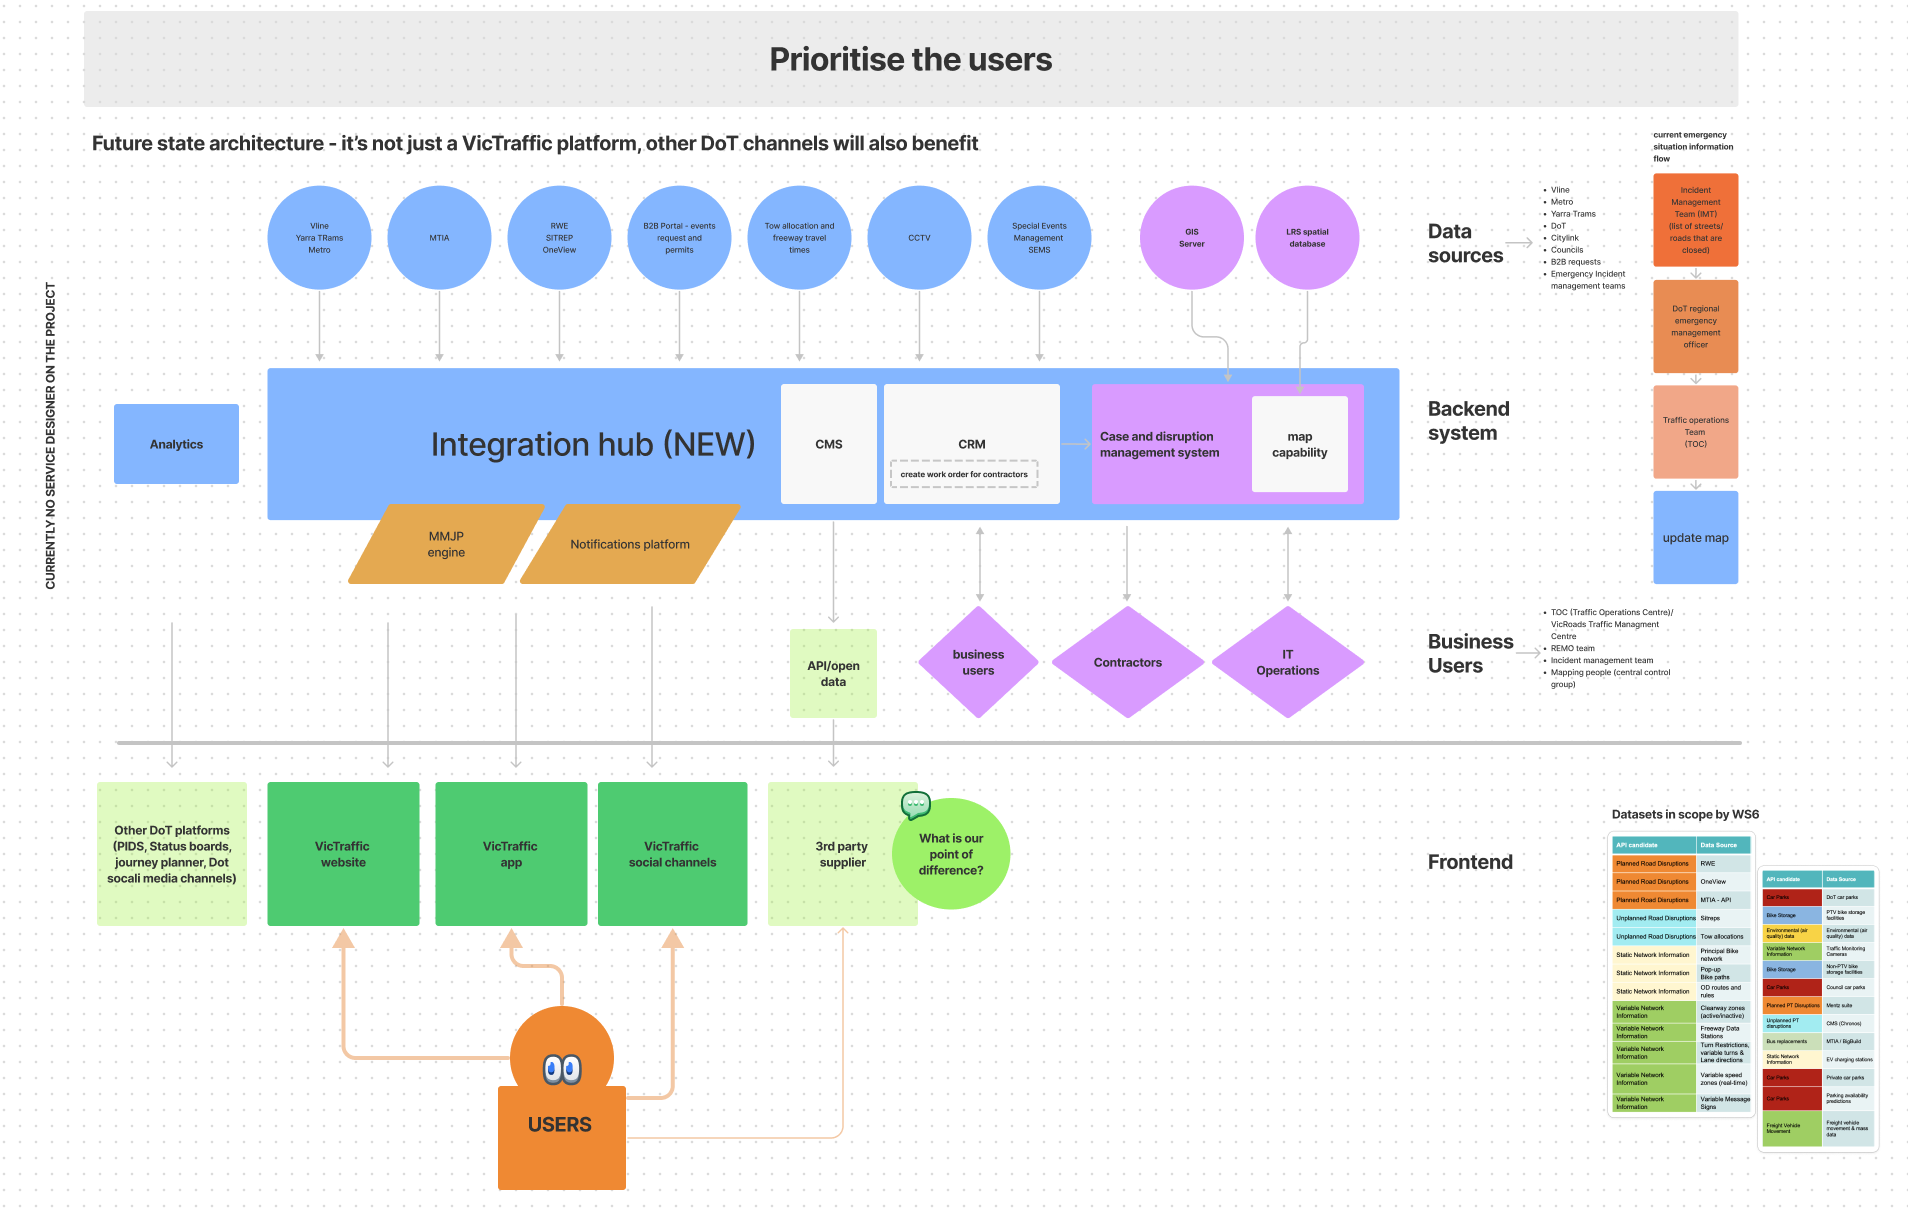
Illustrating the future architecture needed
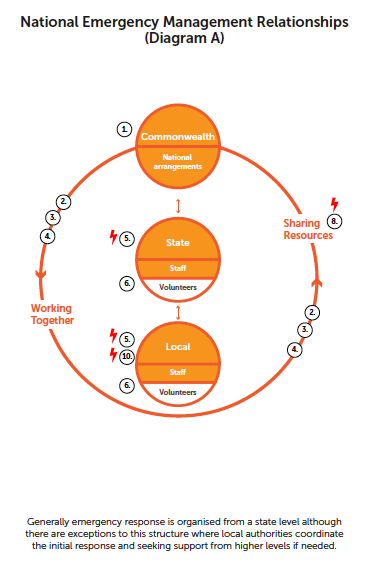
Relationships from local to national organisations
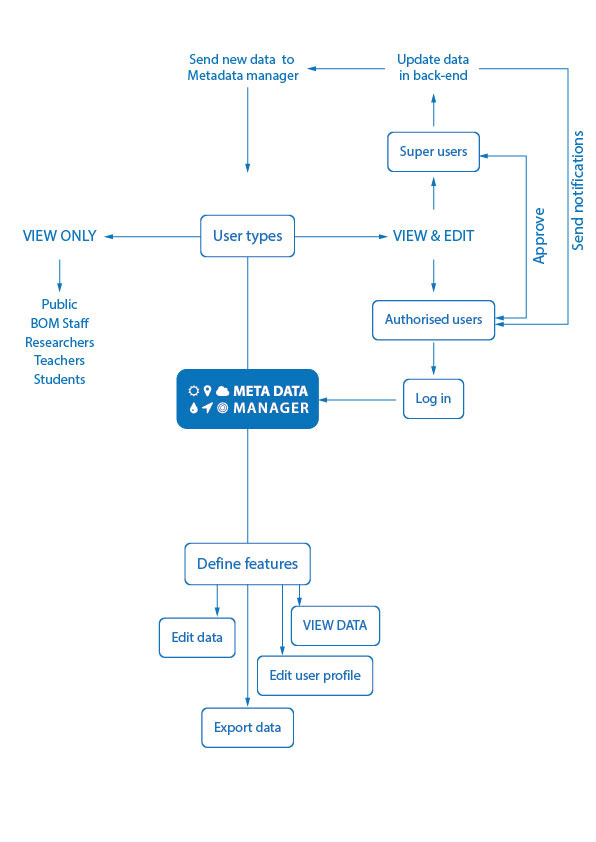
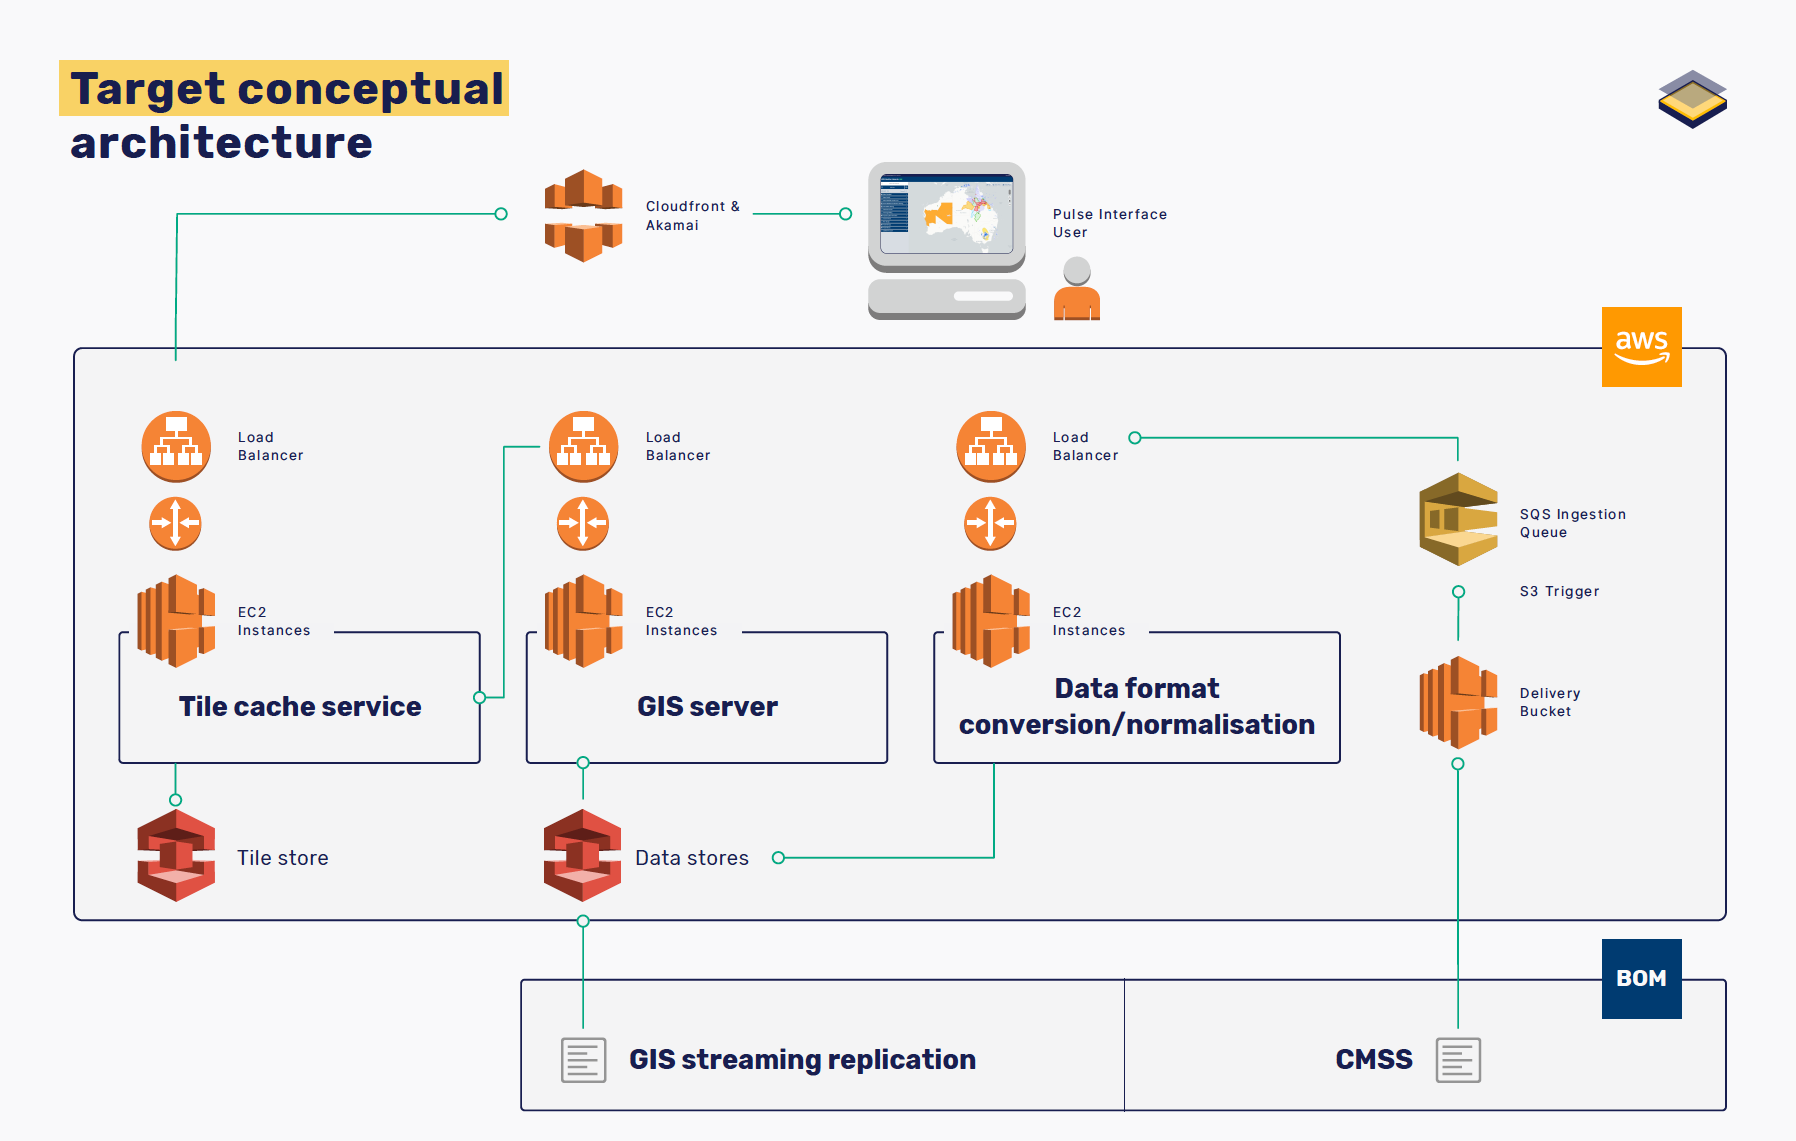
Information architecture and software needs
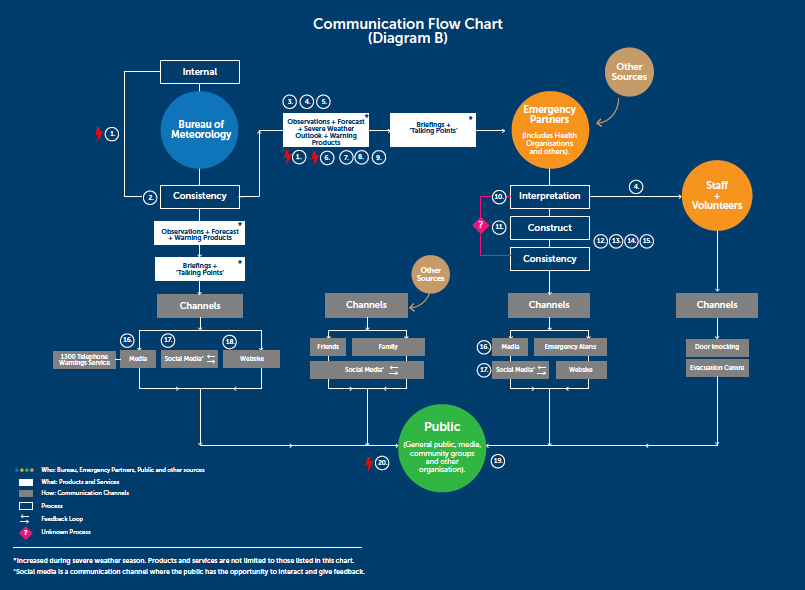
The flow of communication between organisations
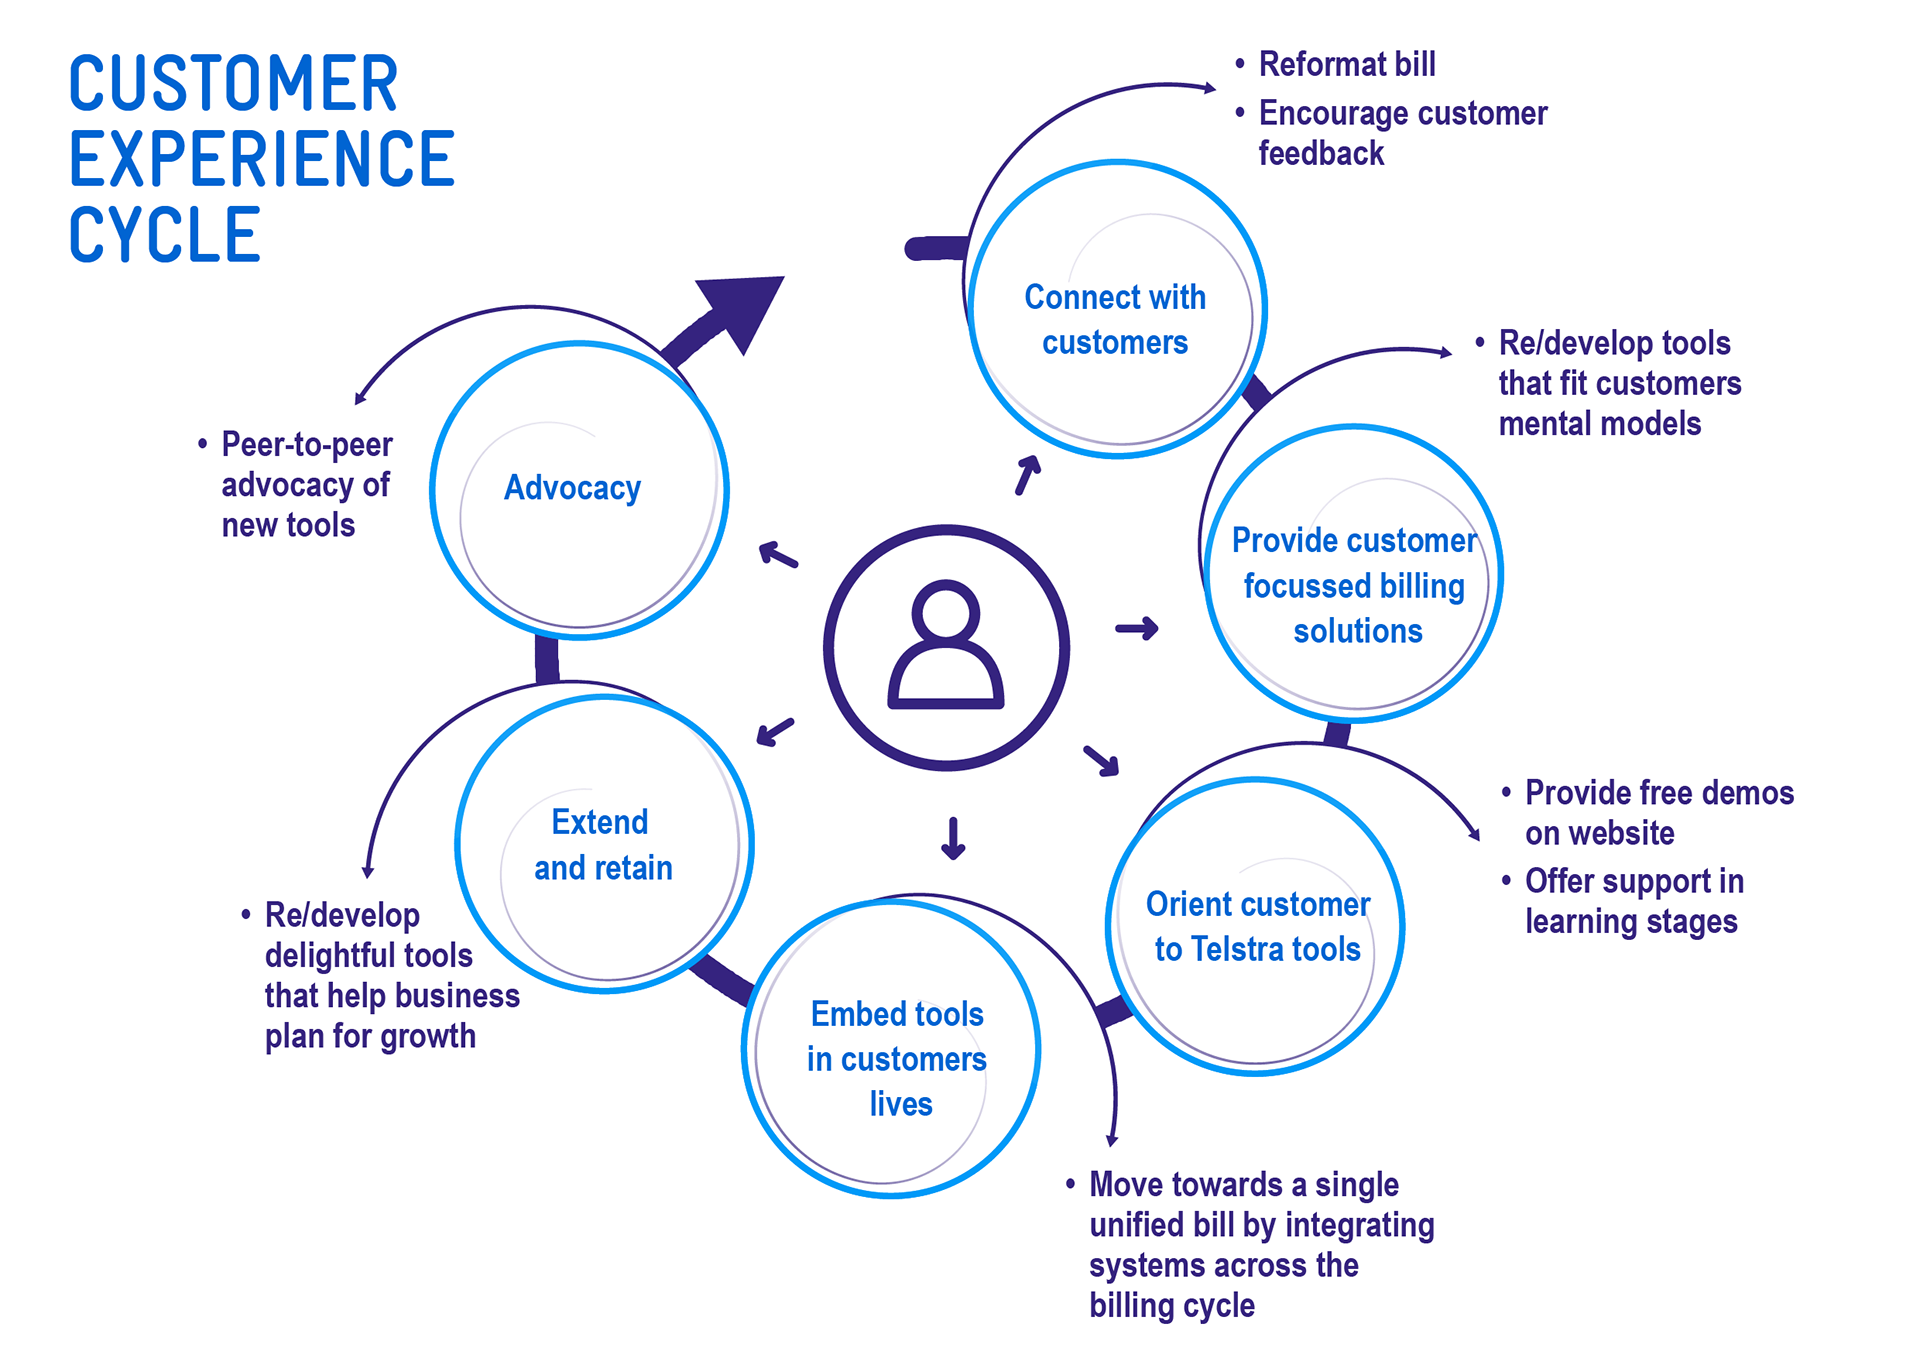
Flow of the customer experience
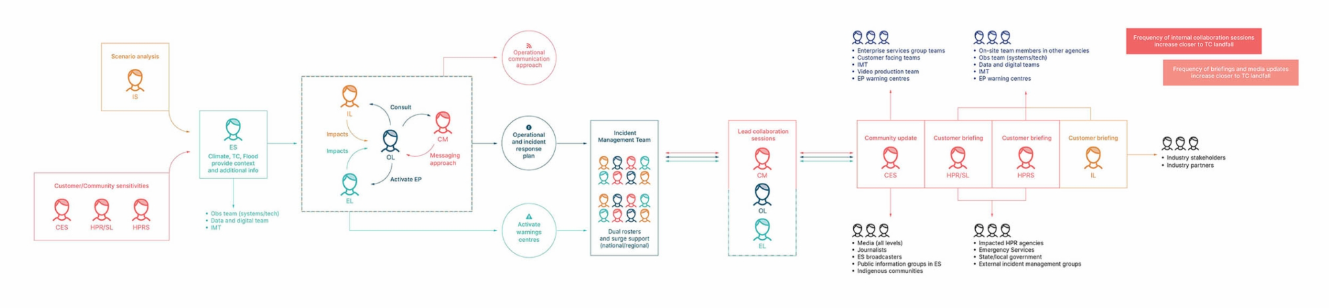
Flow of information between personas