Synthesise findings
Before lockdown I placed post-it notes on windows and whiteboards to synthesise research data. The benefit of working this way, was to get away from the computer and to see a bigger picture emerge. Moving post-it notes around until they fit into a categories made this work very enjoyable. For a project that has a lot of research data and a tight timeline this approach doesn't always work. Excel spreadsheet have also worked but they are harder to work with.
In recent times I've utilised Miro to synthesise research data. This online tool allows me to zoom in and out and move around the board with ease. Another added benefit is that post-it notes don't fall off the board. They stay exactly where they were meant to be.
Combined customer feedback on post-it notes
Key insights created after sorting through categories
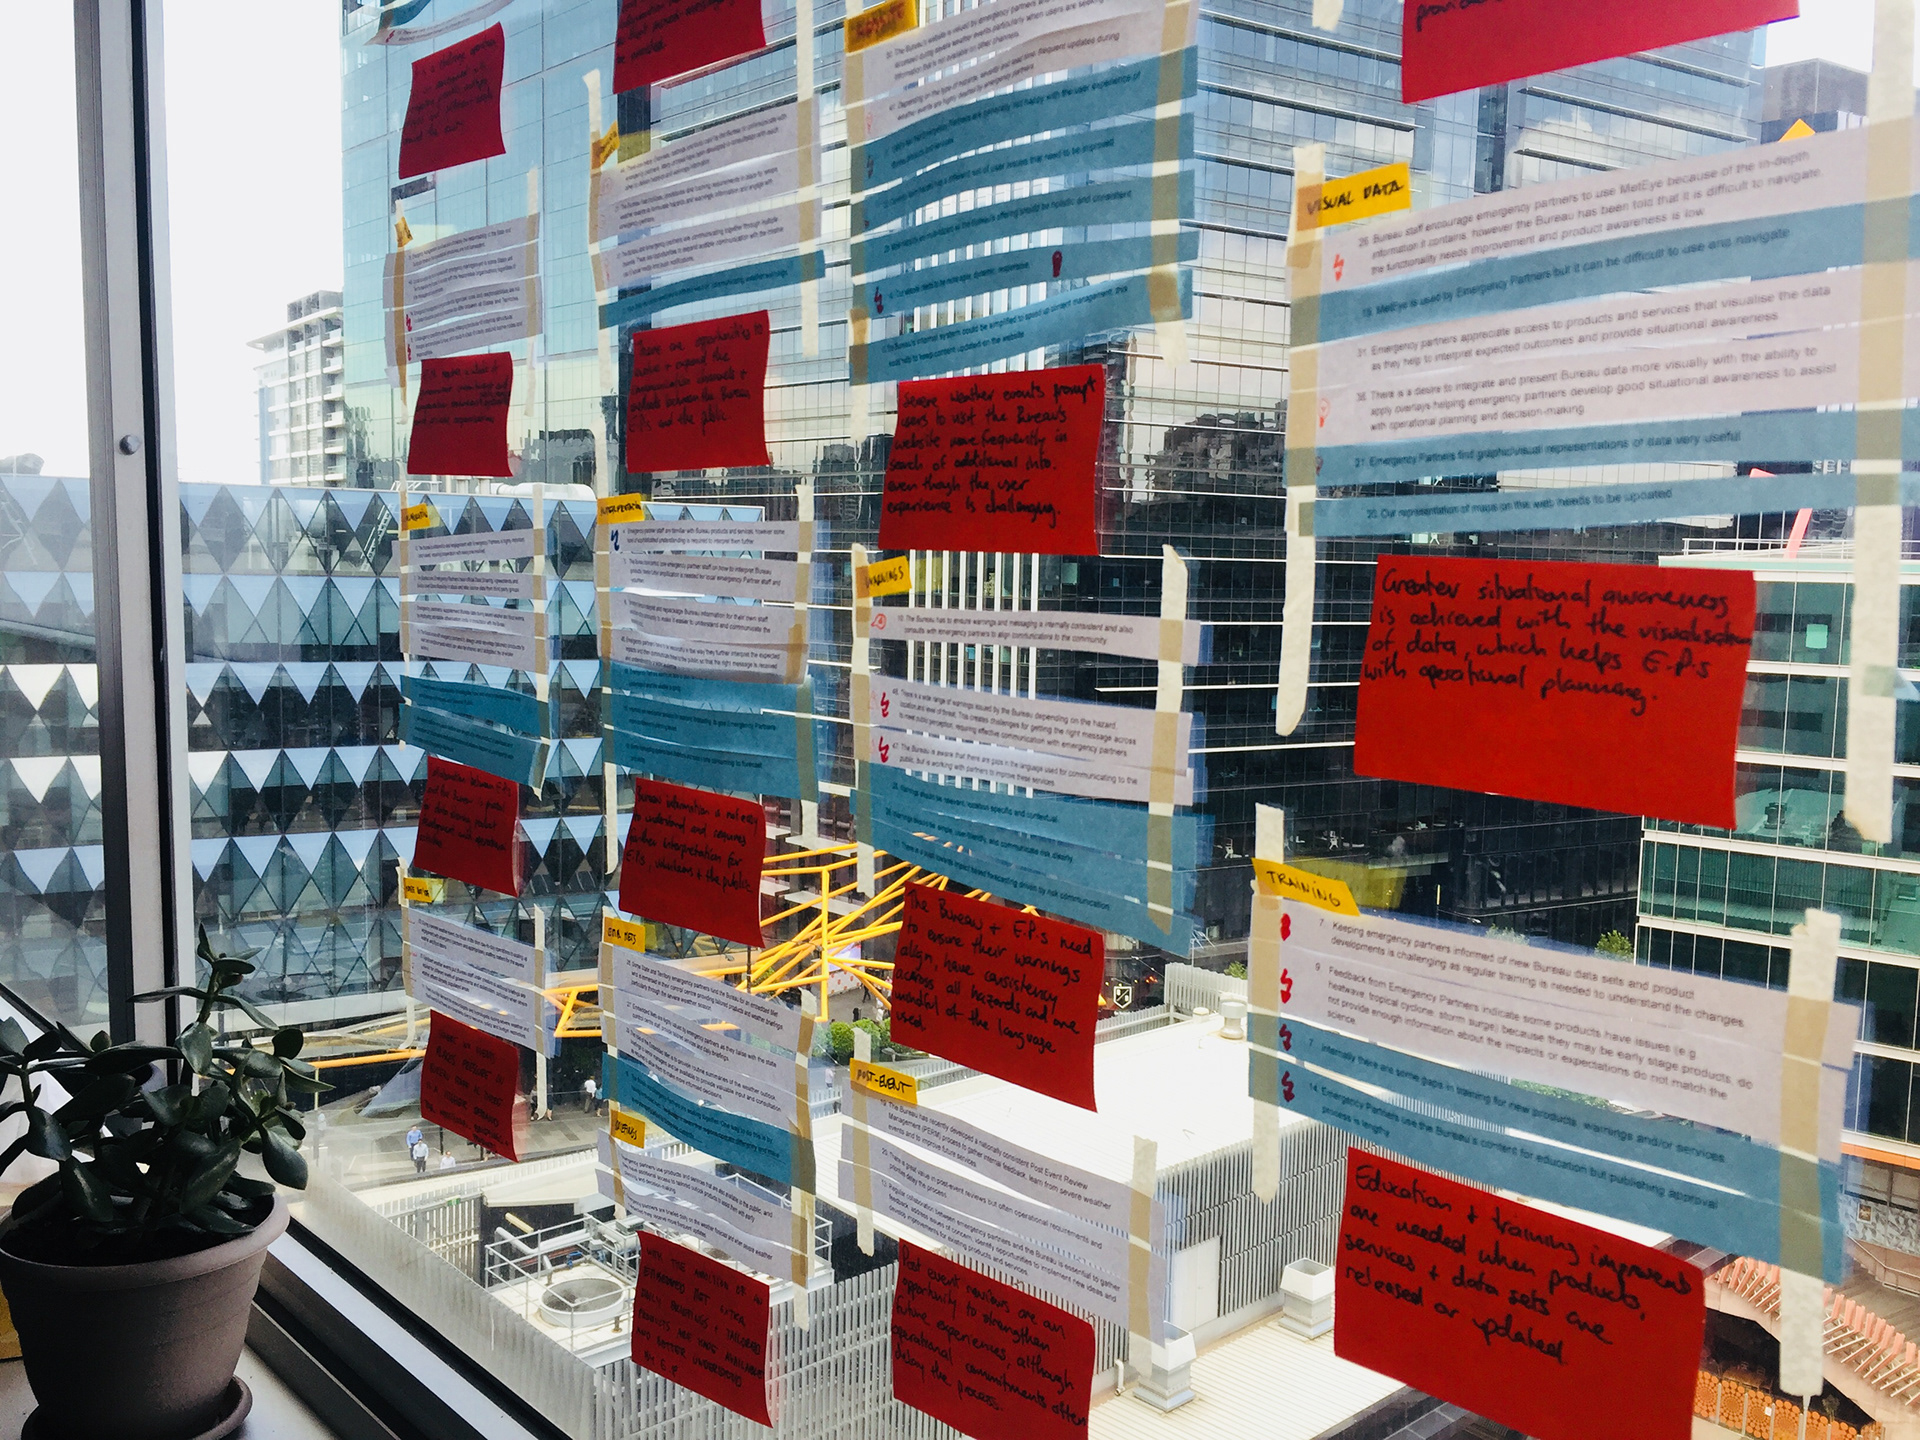
Post-it notes organised by categories
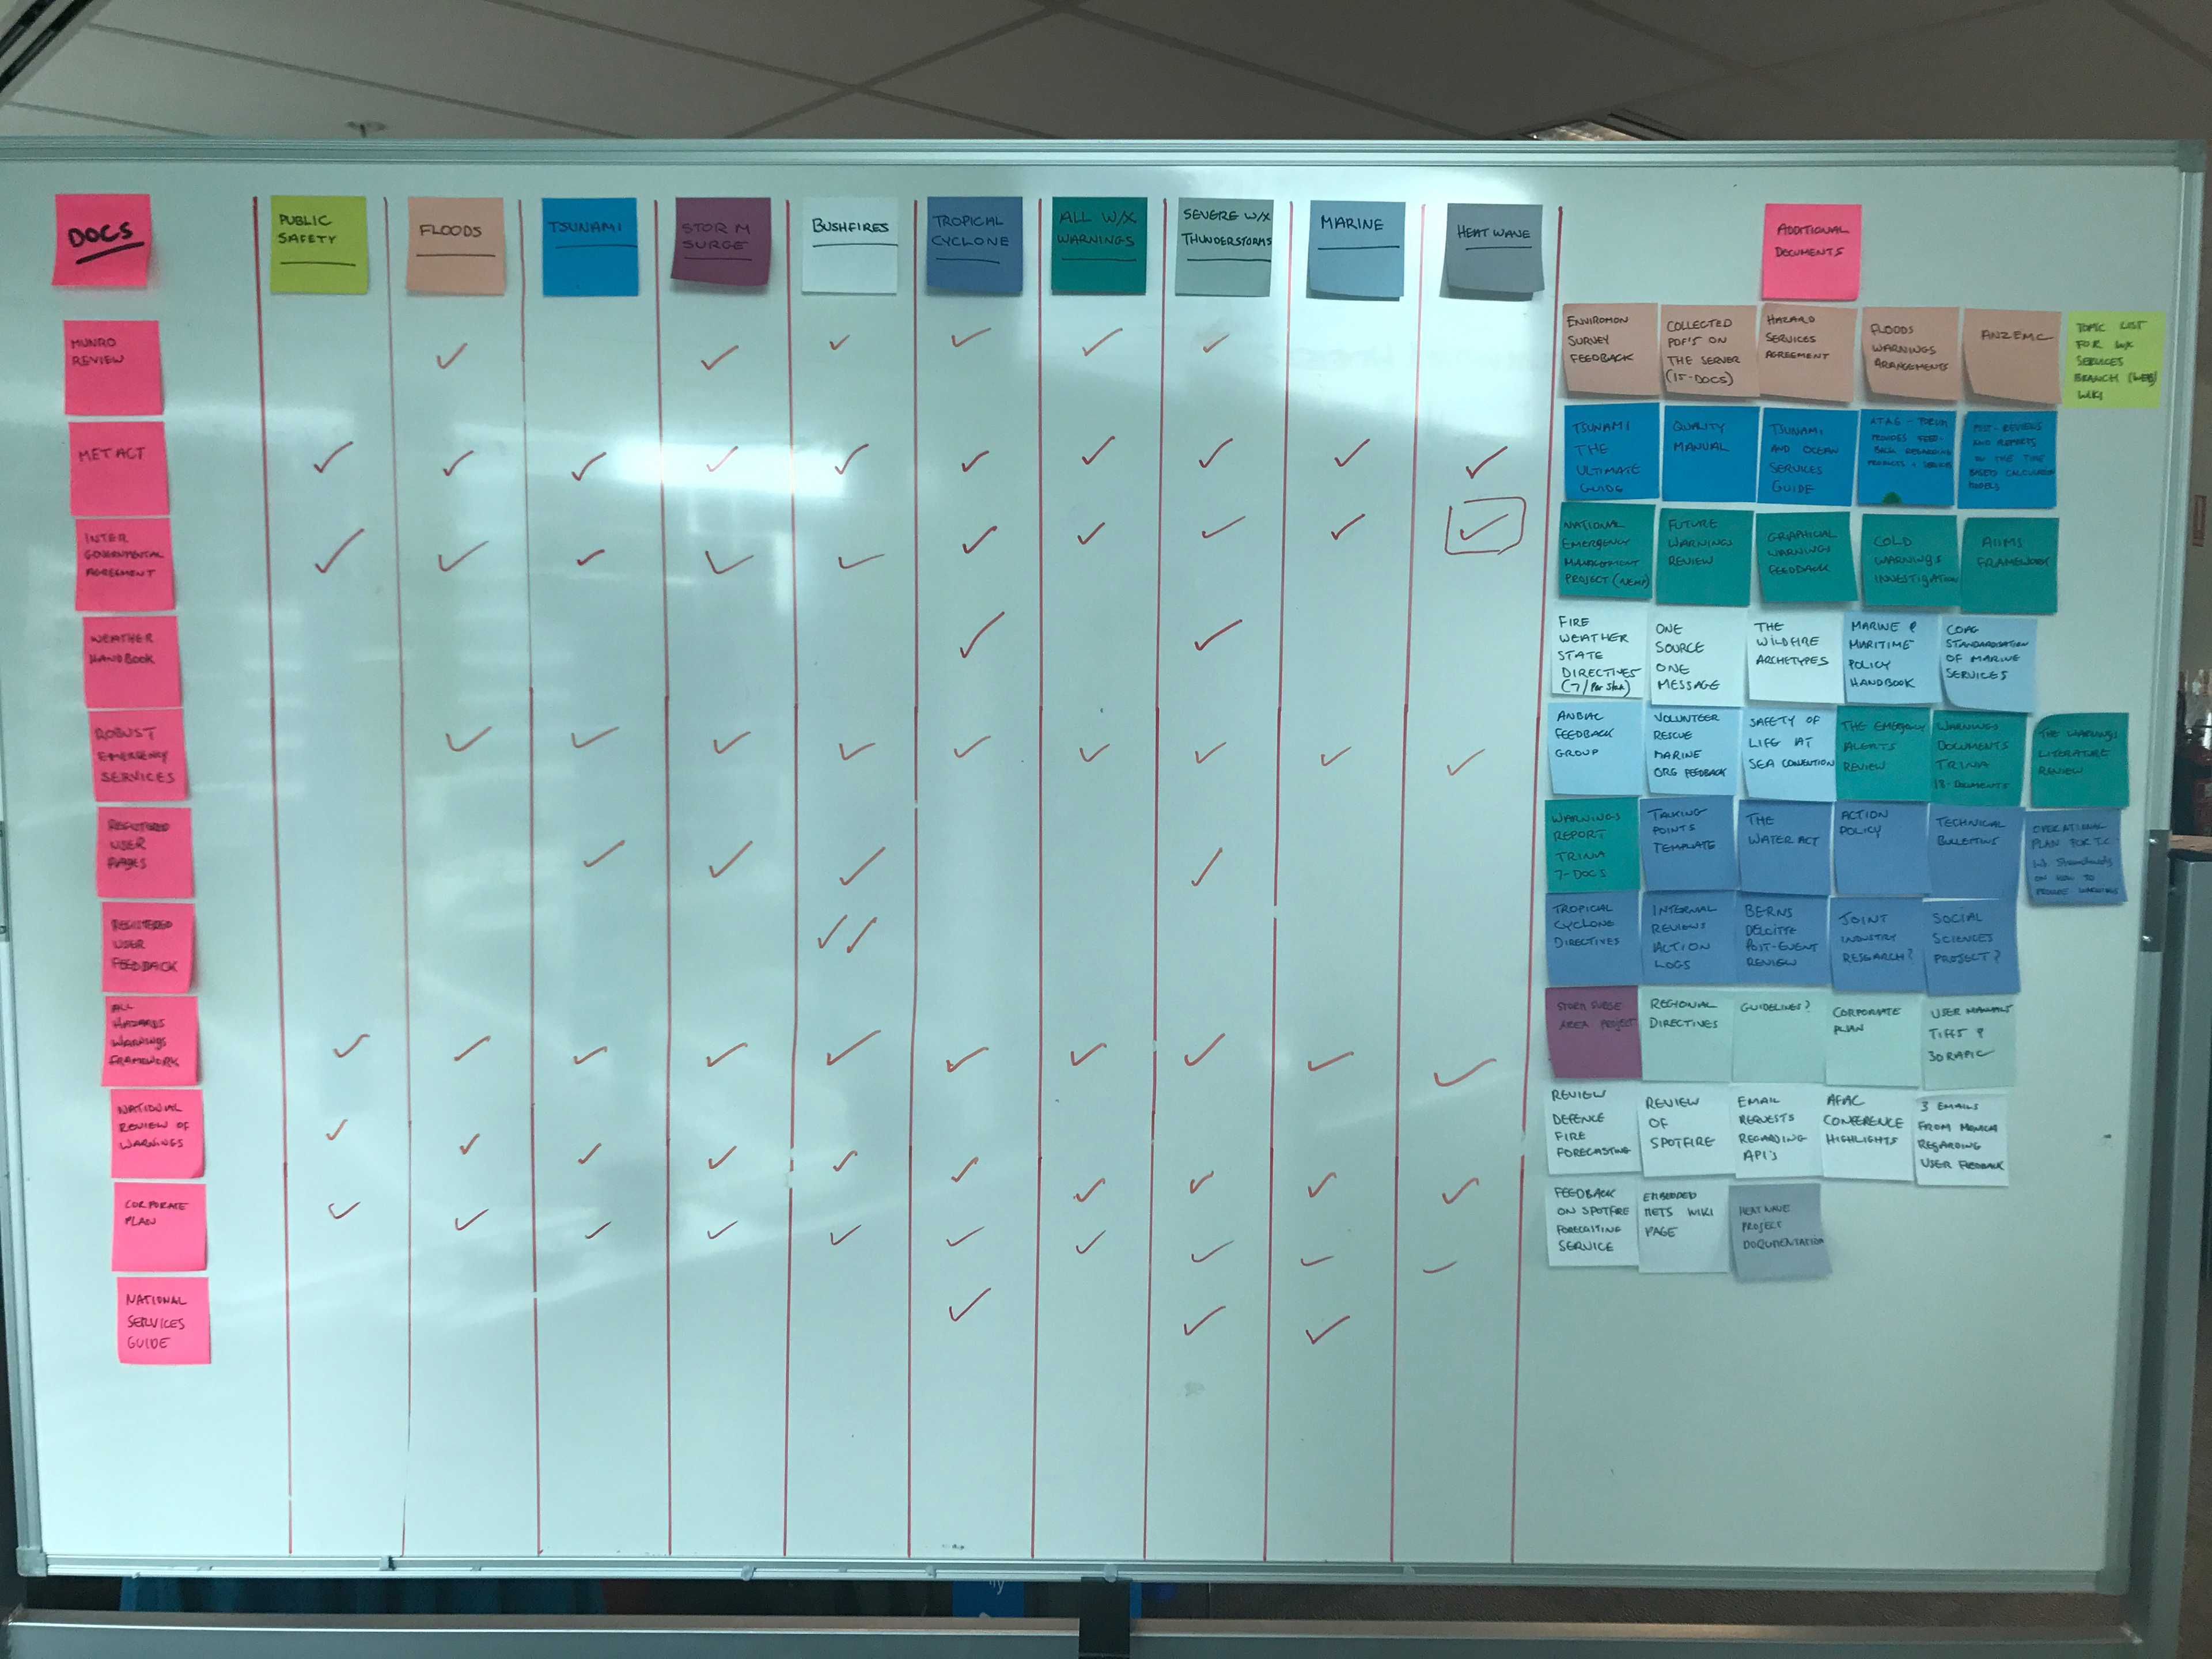
Hazards matrix and related policies
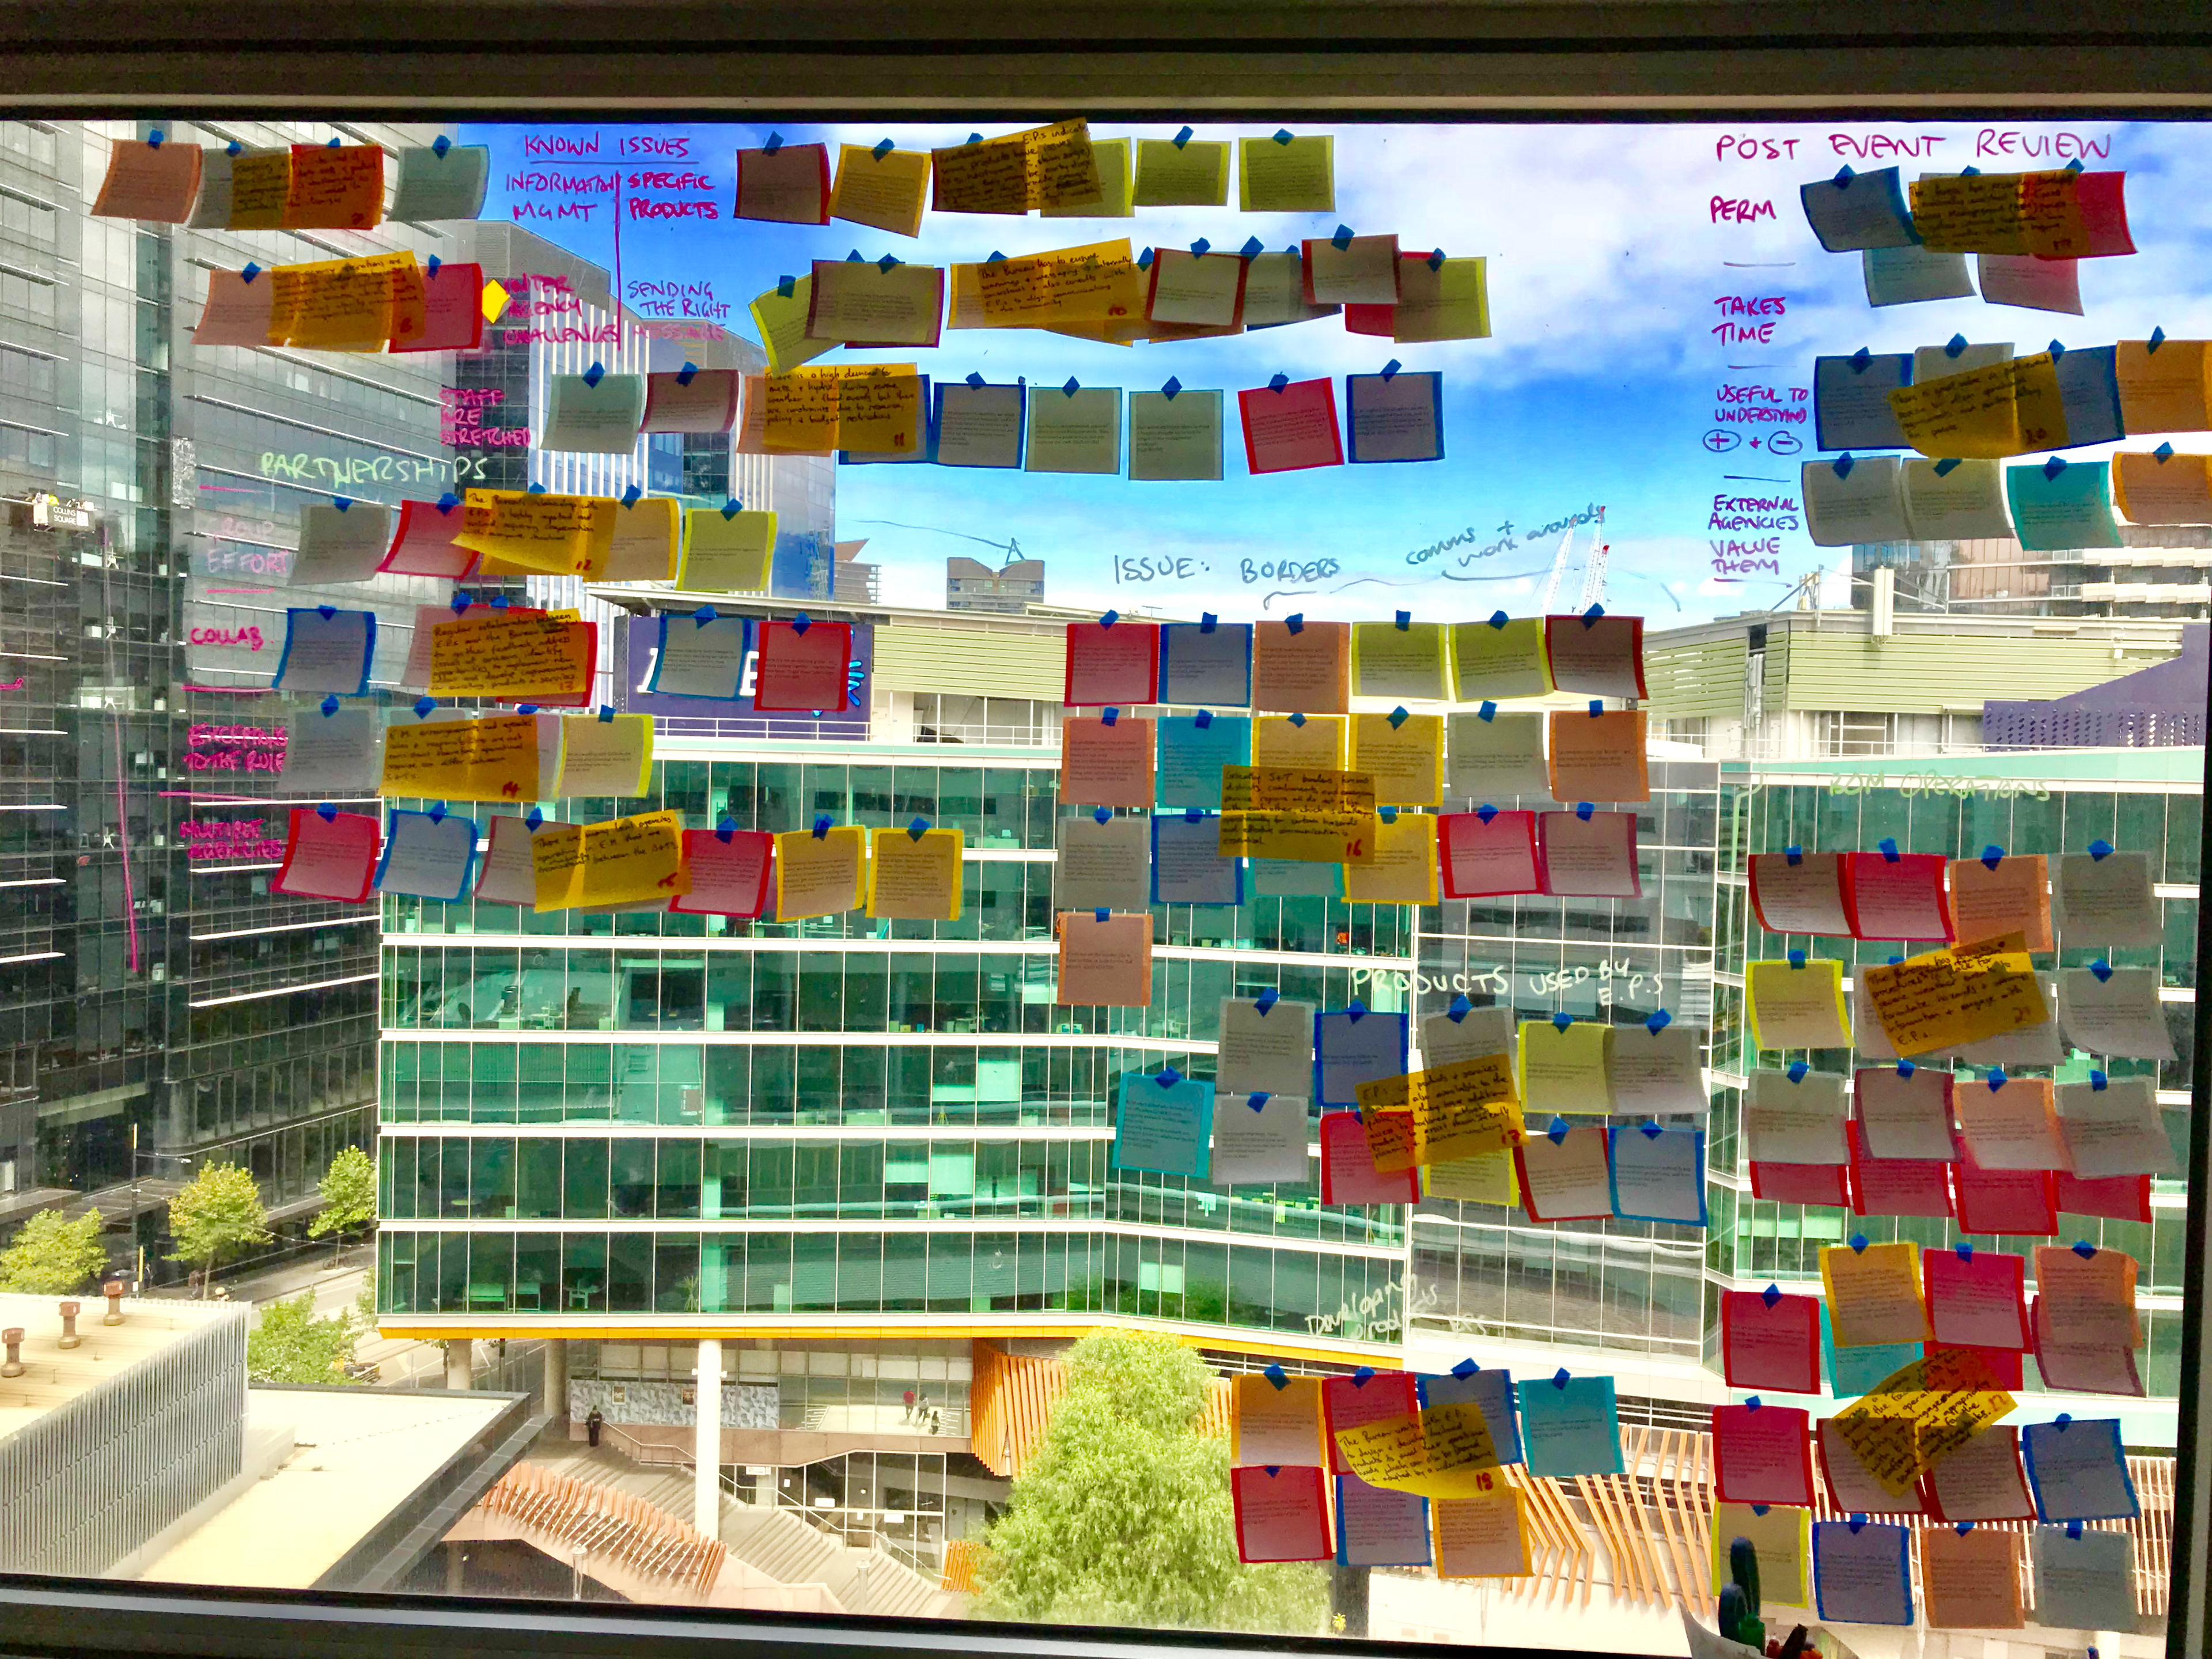
Working out categories for pos-its
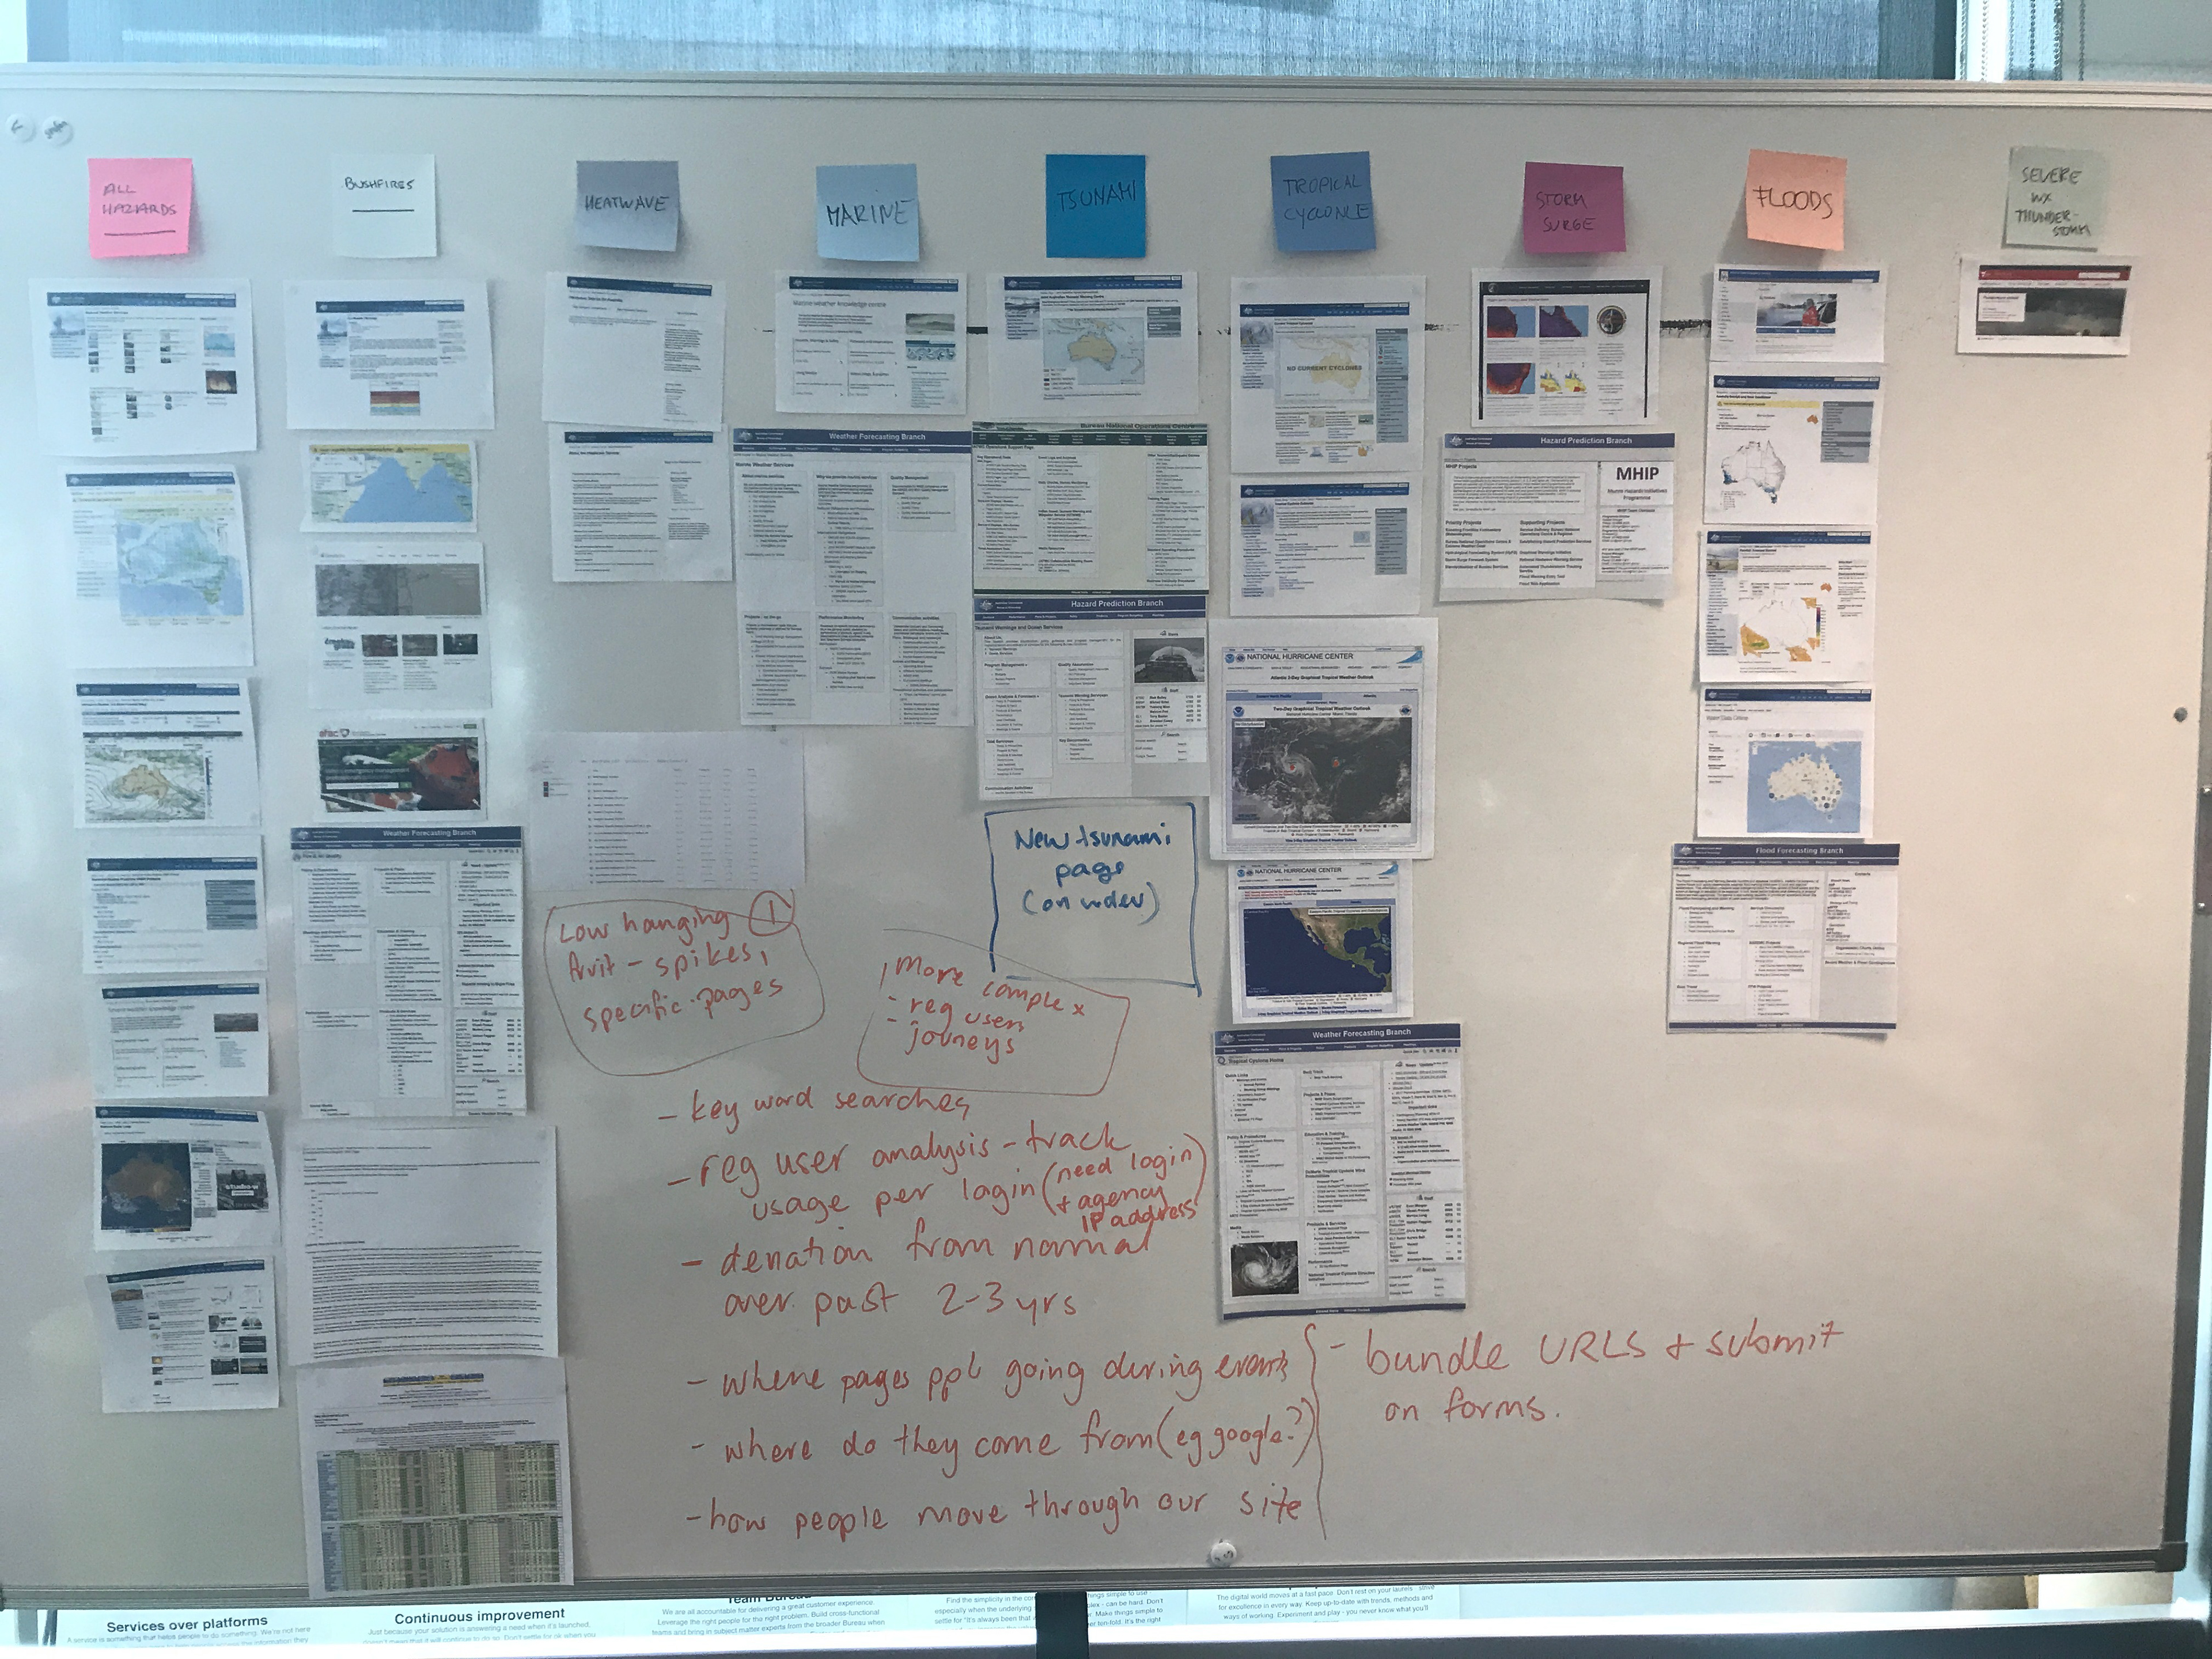
Hazards overview on the website
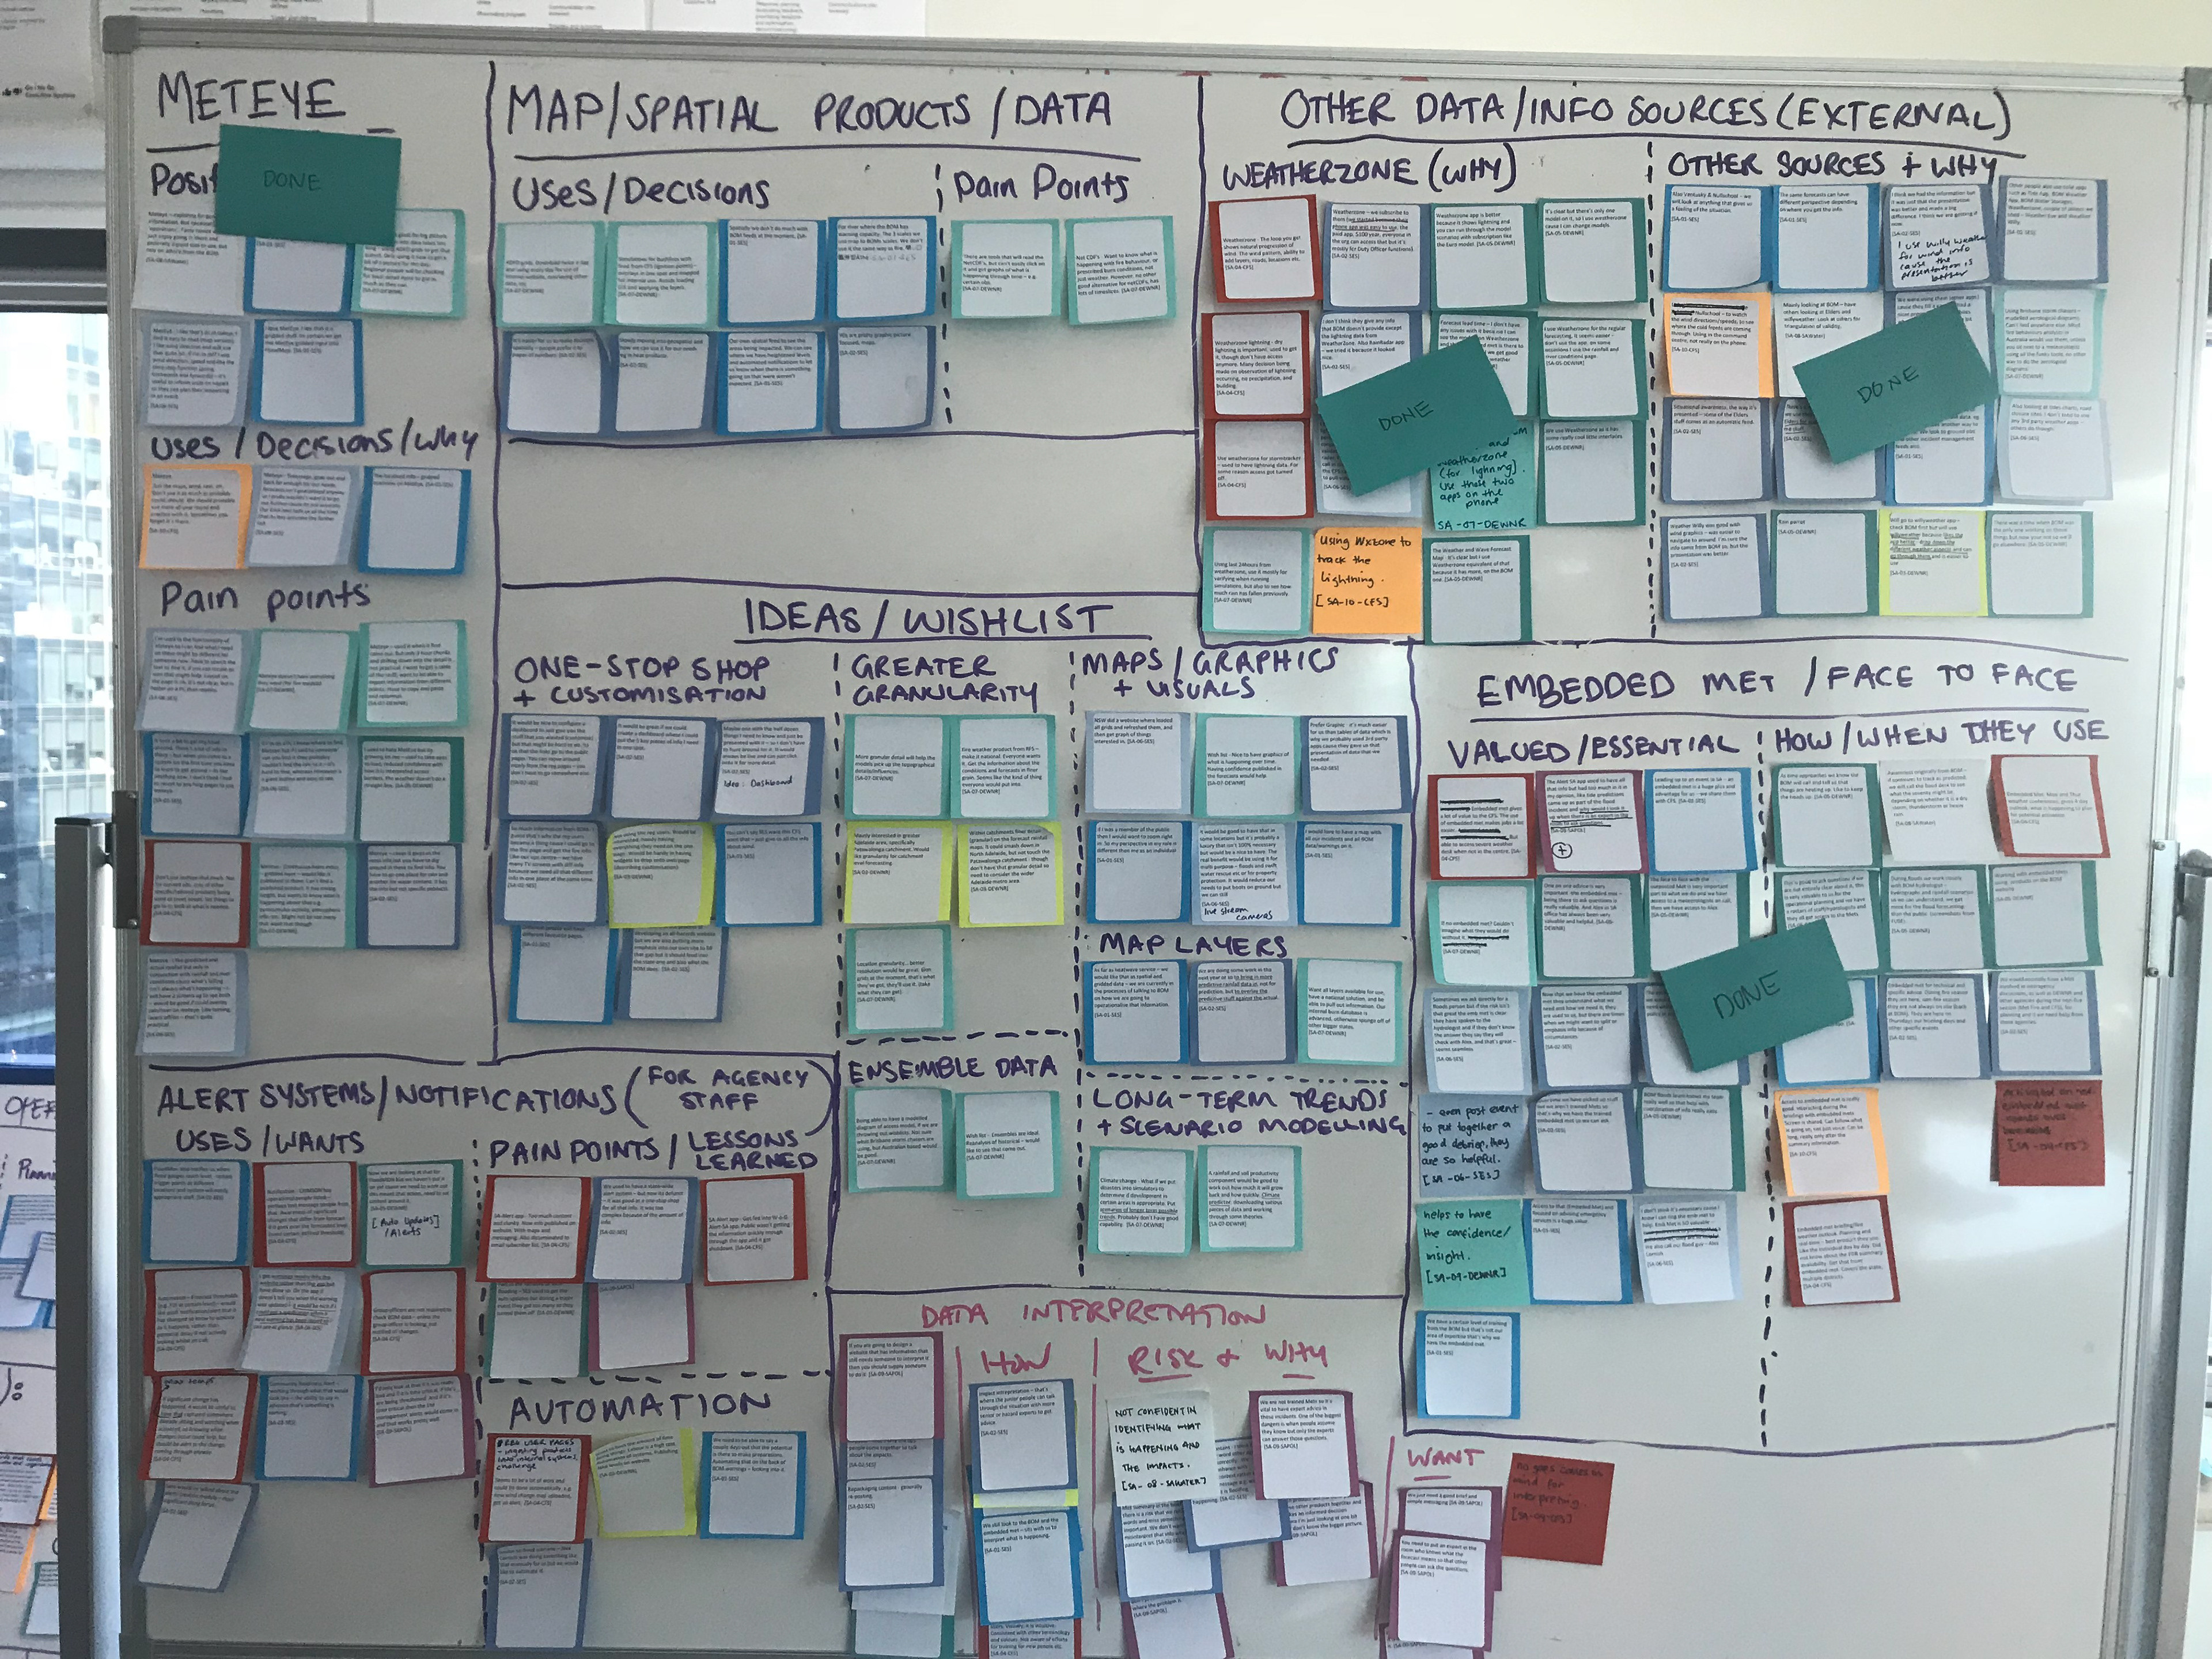
Combining key insights
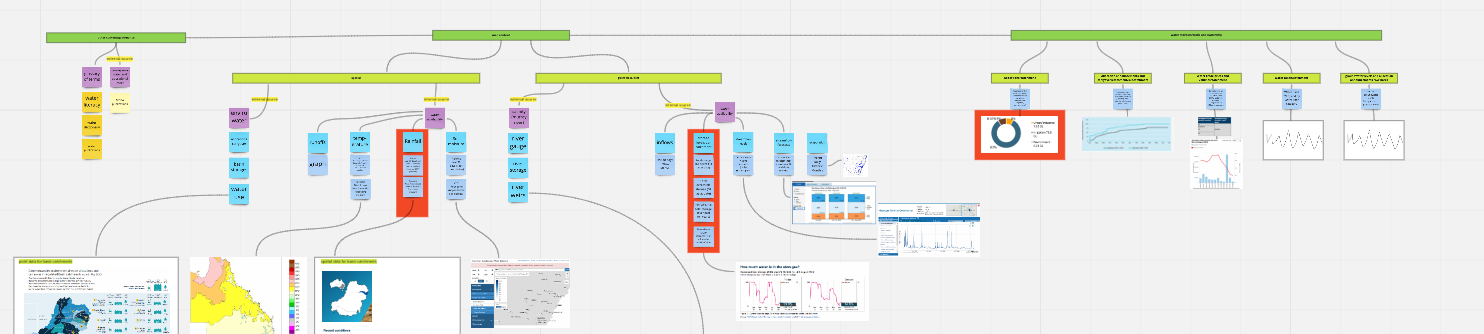
Synthesising categories in Miro
Sorting and categorising survey inputs
Key insights created in Miro
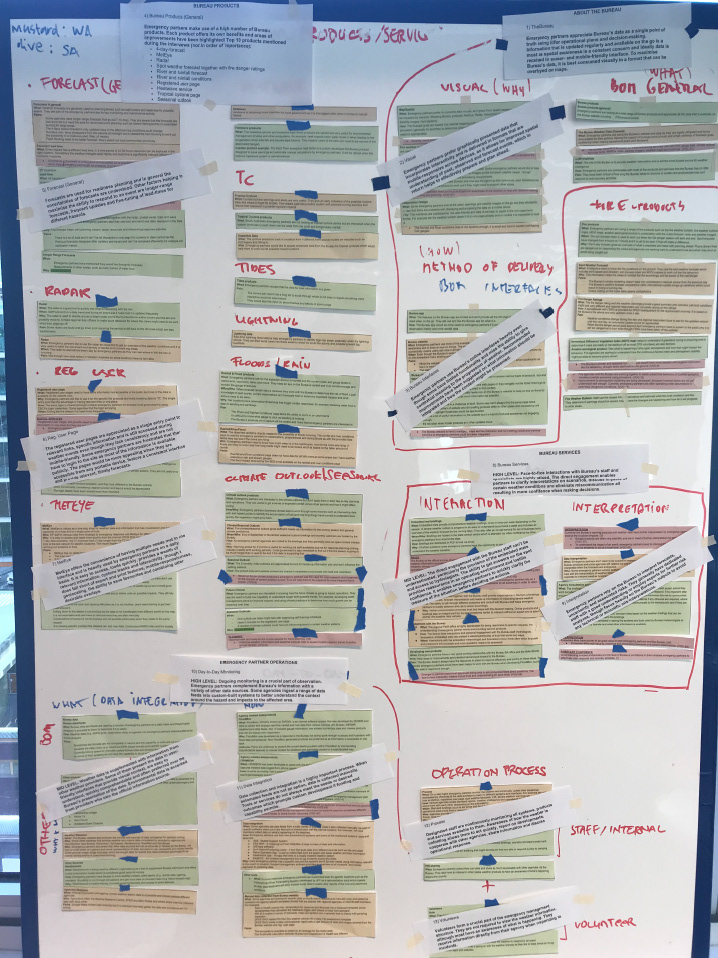
Qualitative analysis
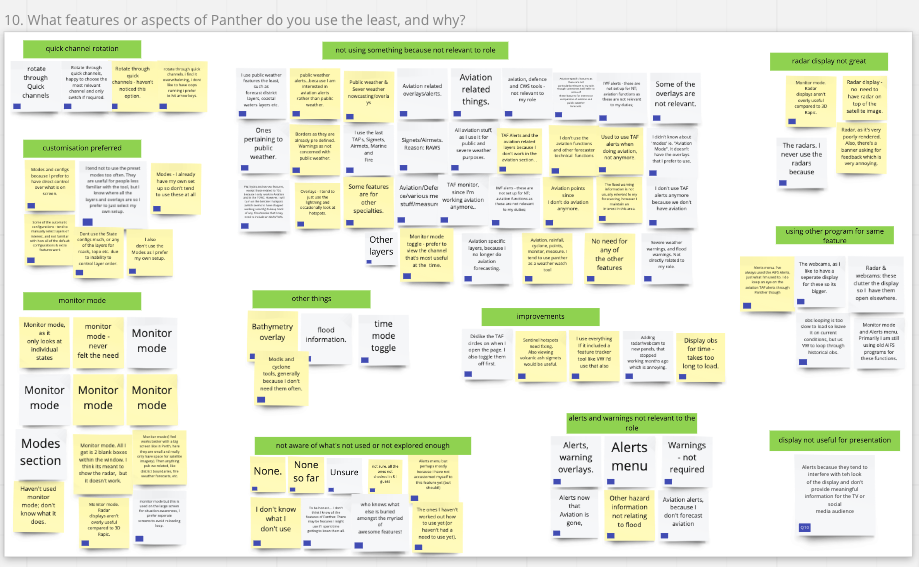
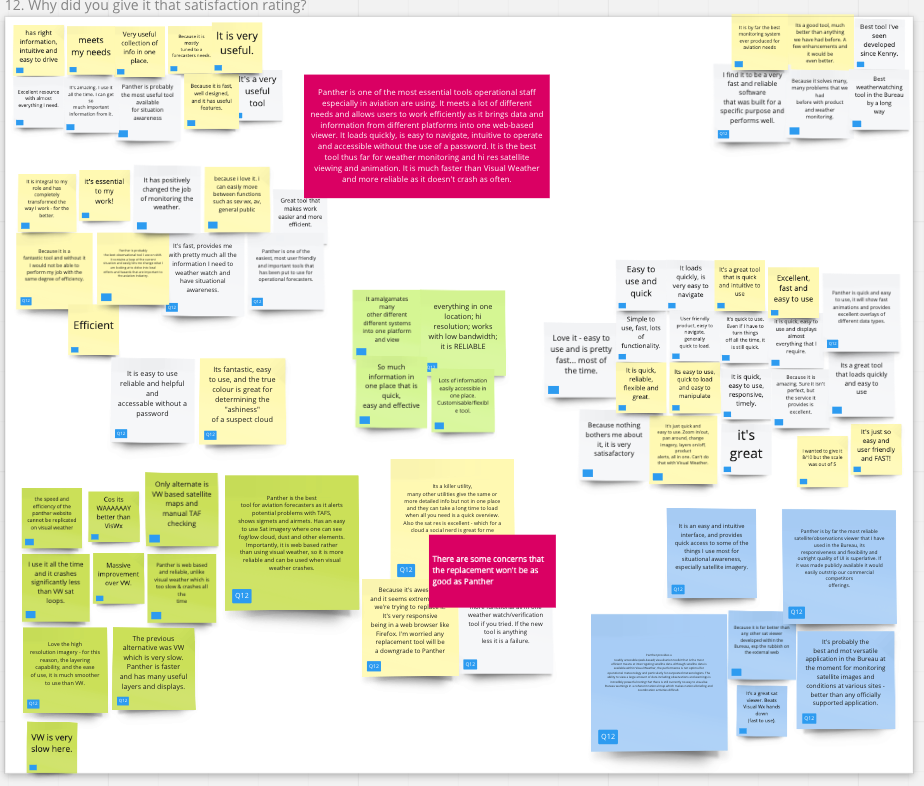
Synthesising the research data into categories and coming up with key insights leads to opportunities to present them into different artefacts to communicate findings and recommendations. Artefacts are always accompanied with a research report that summarises the the research approach and outcomes.
Artefacts from qualitative analysis may include semantic differentials, design principles, journey maps, diagrams, archetypes/personas or concept designs which are all great tools that support the report.
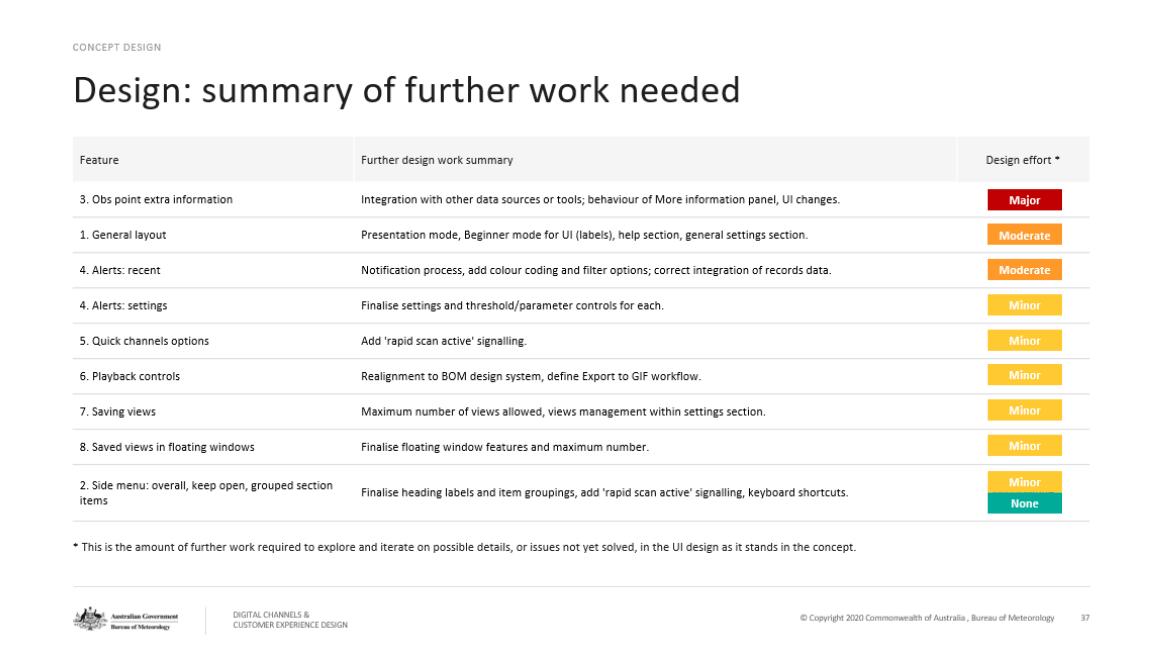
Below are a few different examples of artefacts I used to support reports or presentations.
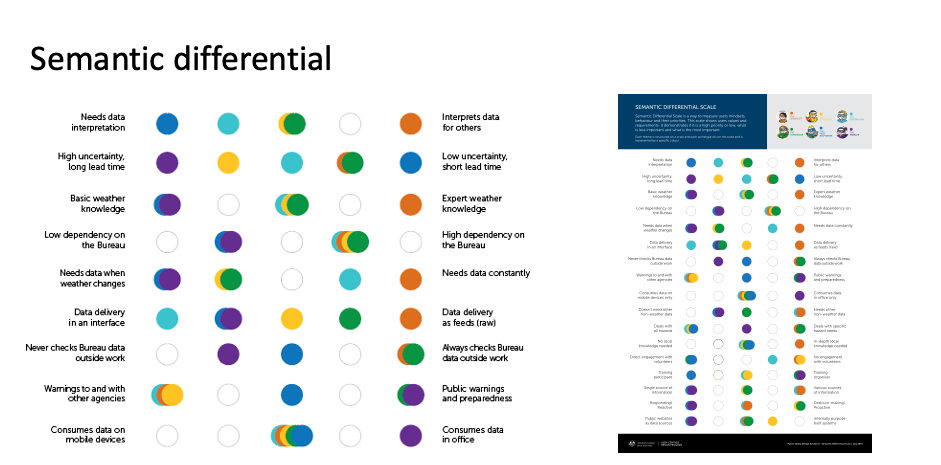
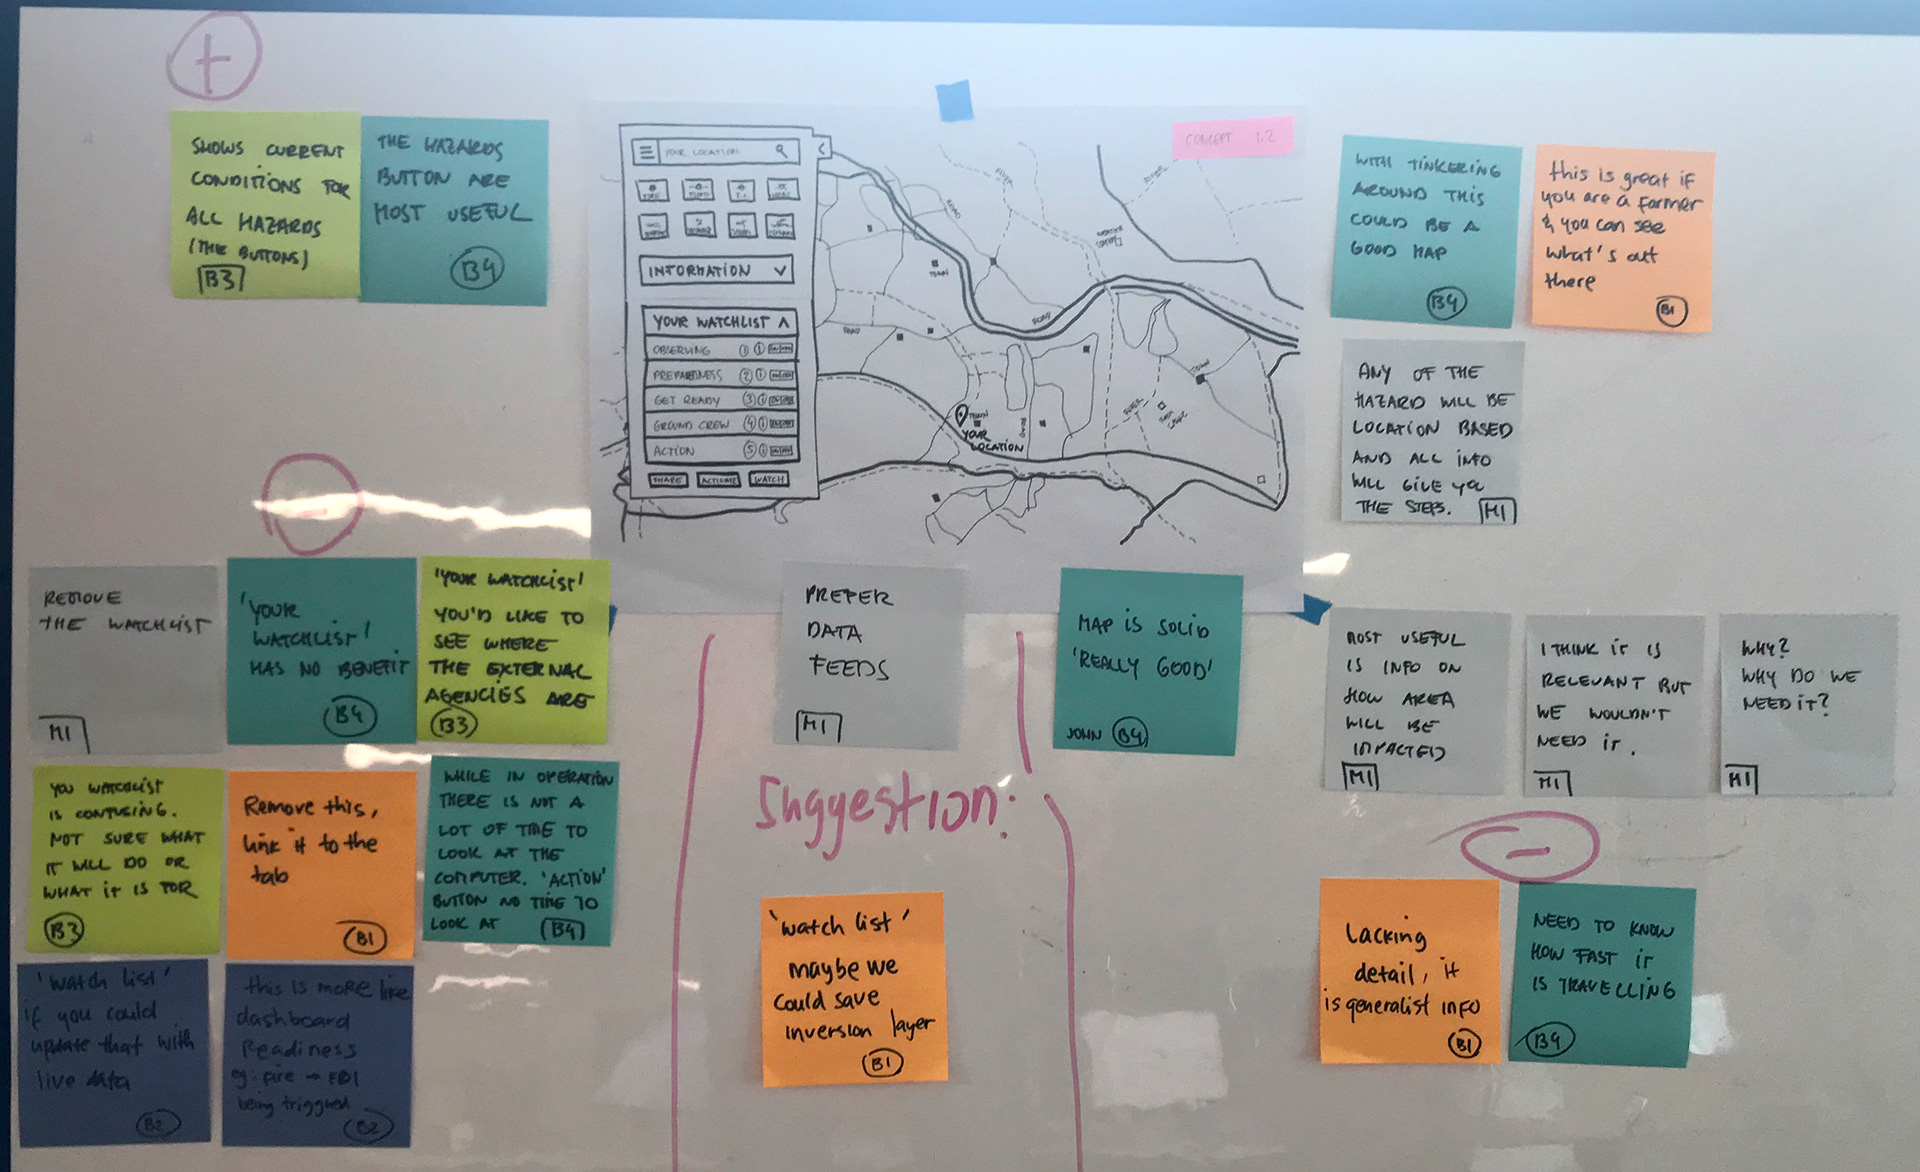
A semantic differential helps to identify where personas have the same goals
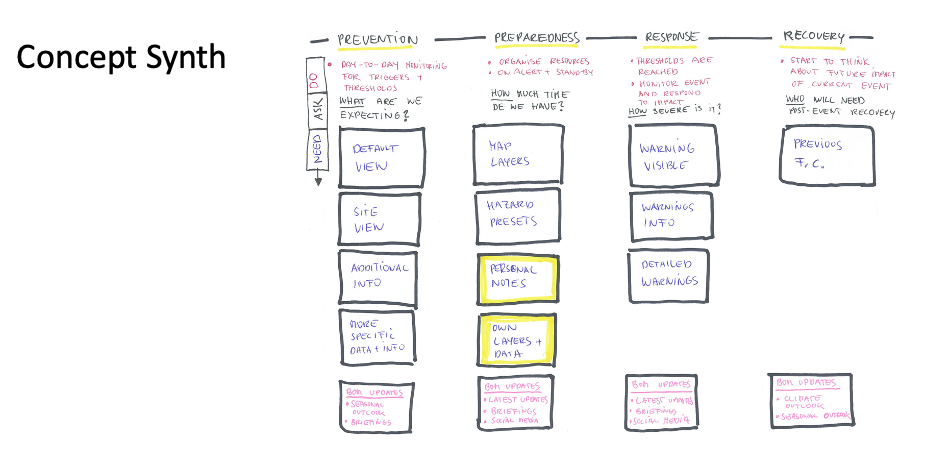
A semi-diagram of pages needed for a new interface
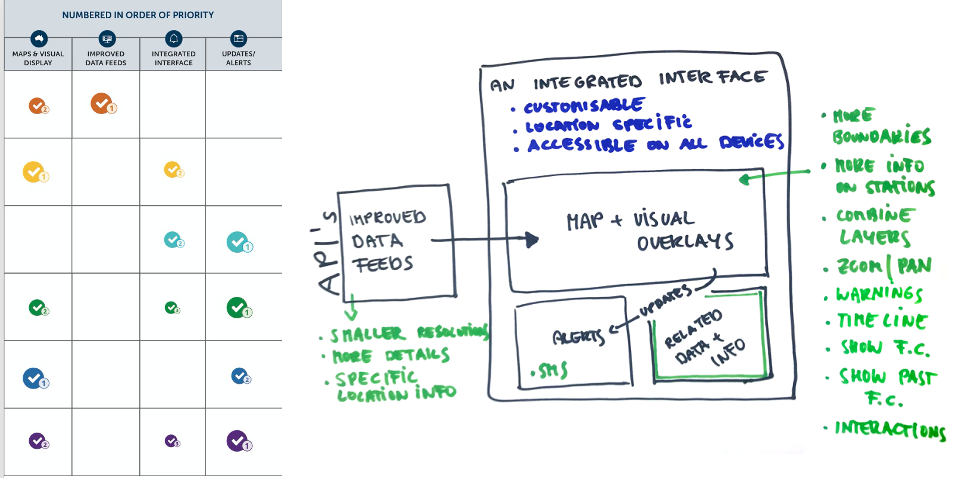
An sketch of an interface based on user needs
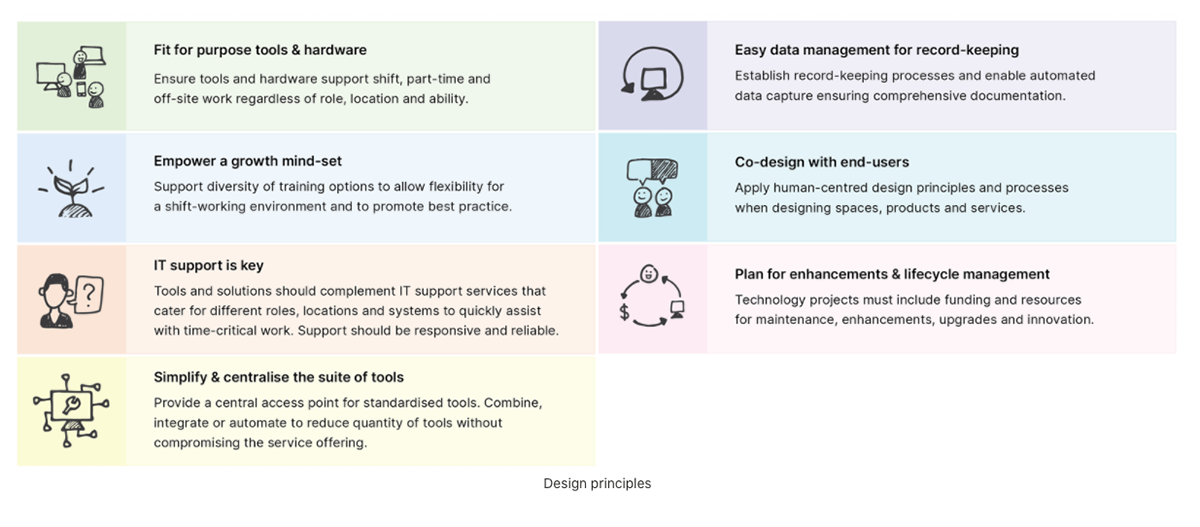
Design principles created after shadow interviews with forecasters
Reporting
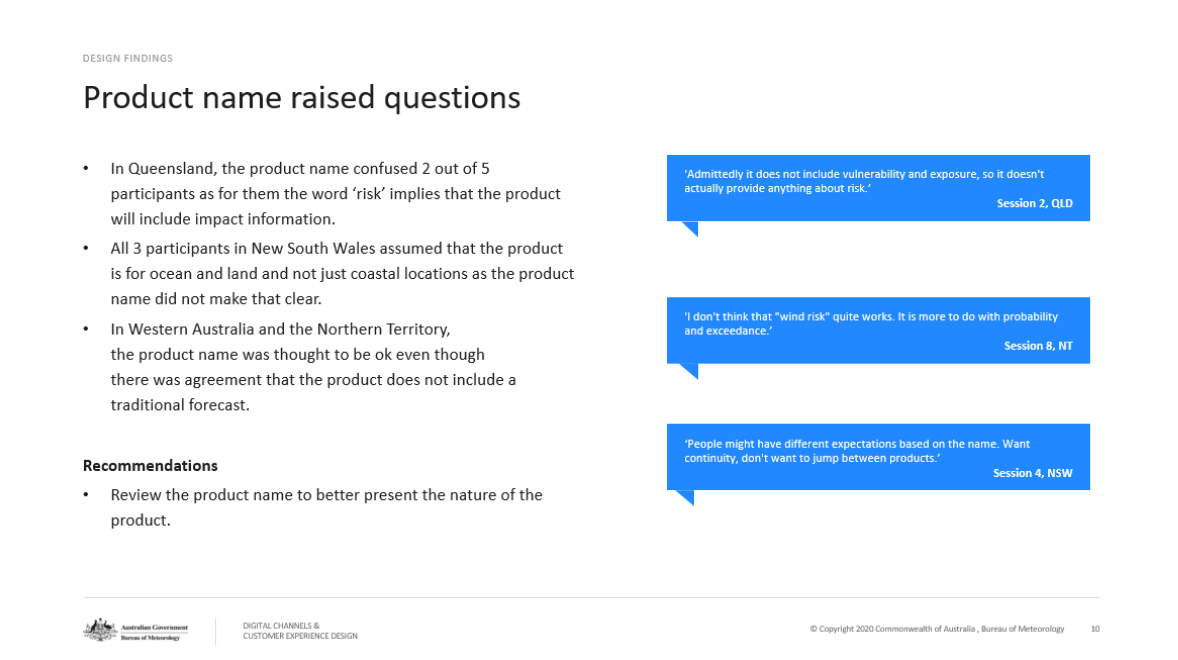
Reporting the research findings and making recommendations is where the fruits of the labour become visible. I tend to include the background information, the research approach and methods, participants demographic information, CES and CSAT measures, key insights, participants quotes and images, artefacts, graphs and charts, supporting materials and anything else that helps to tell and visualise the story, the process and the outcomes.
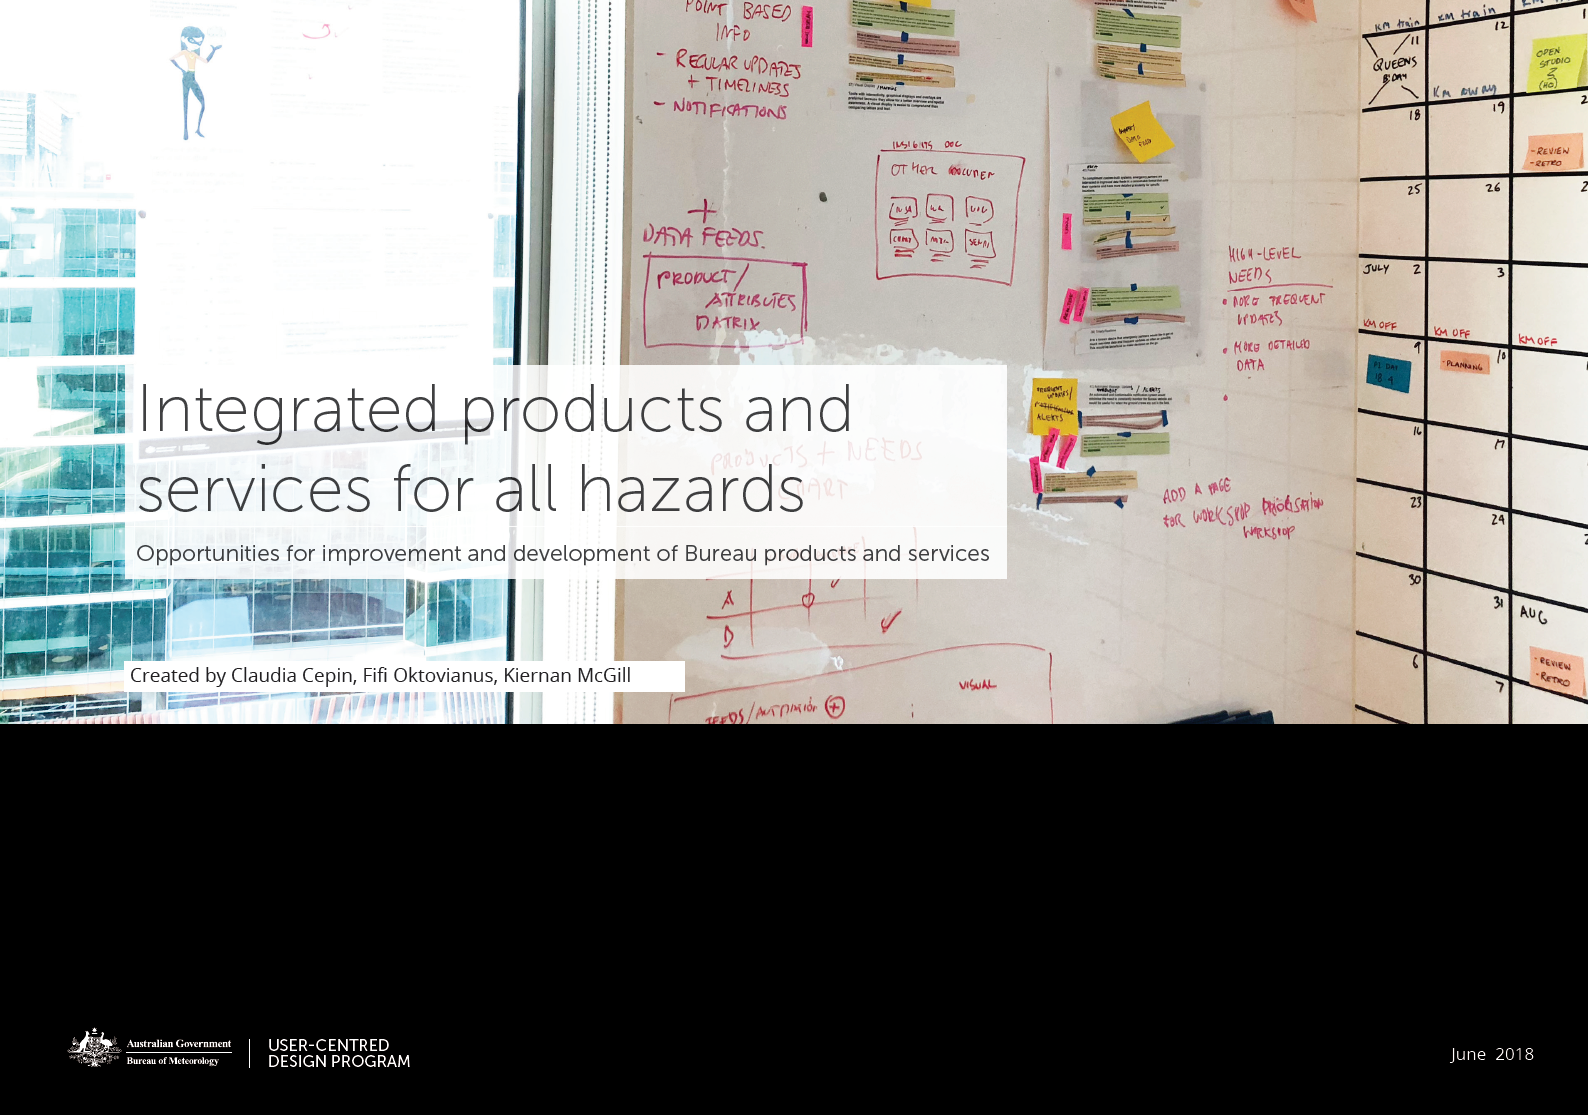
Below are some examples of covers and pages for different research reports I worked on.