
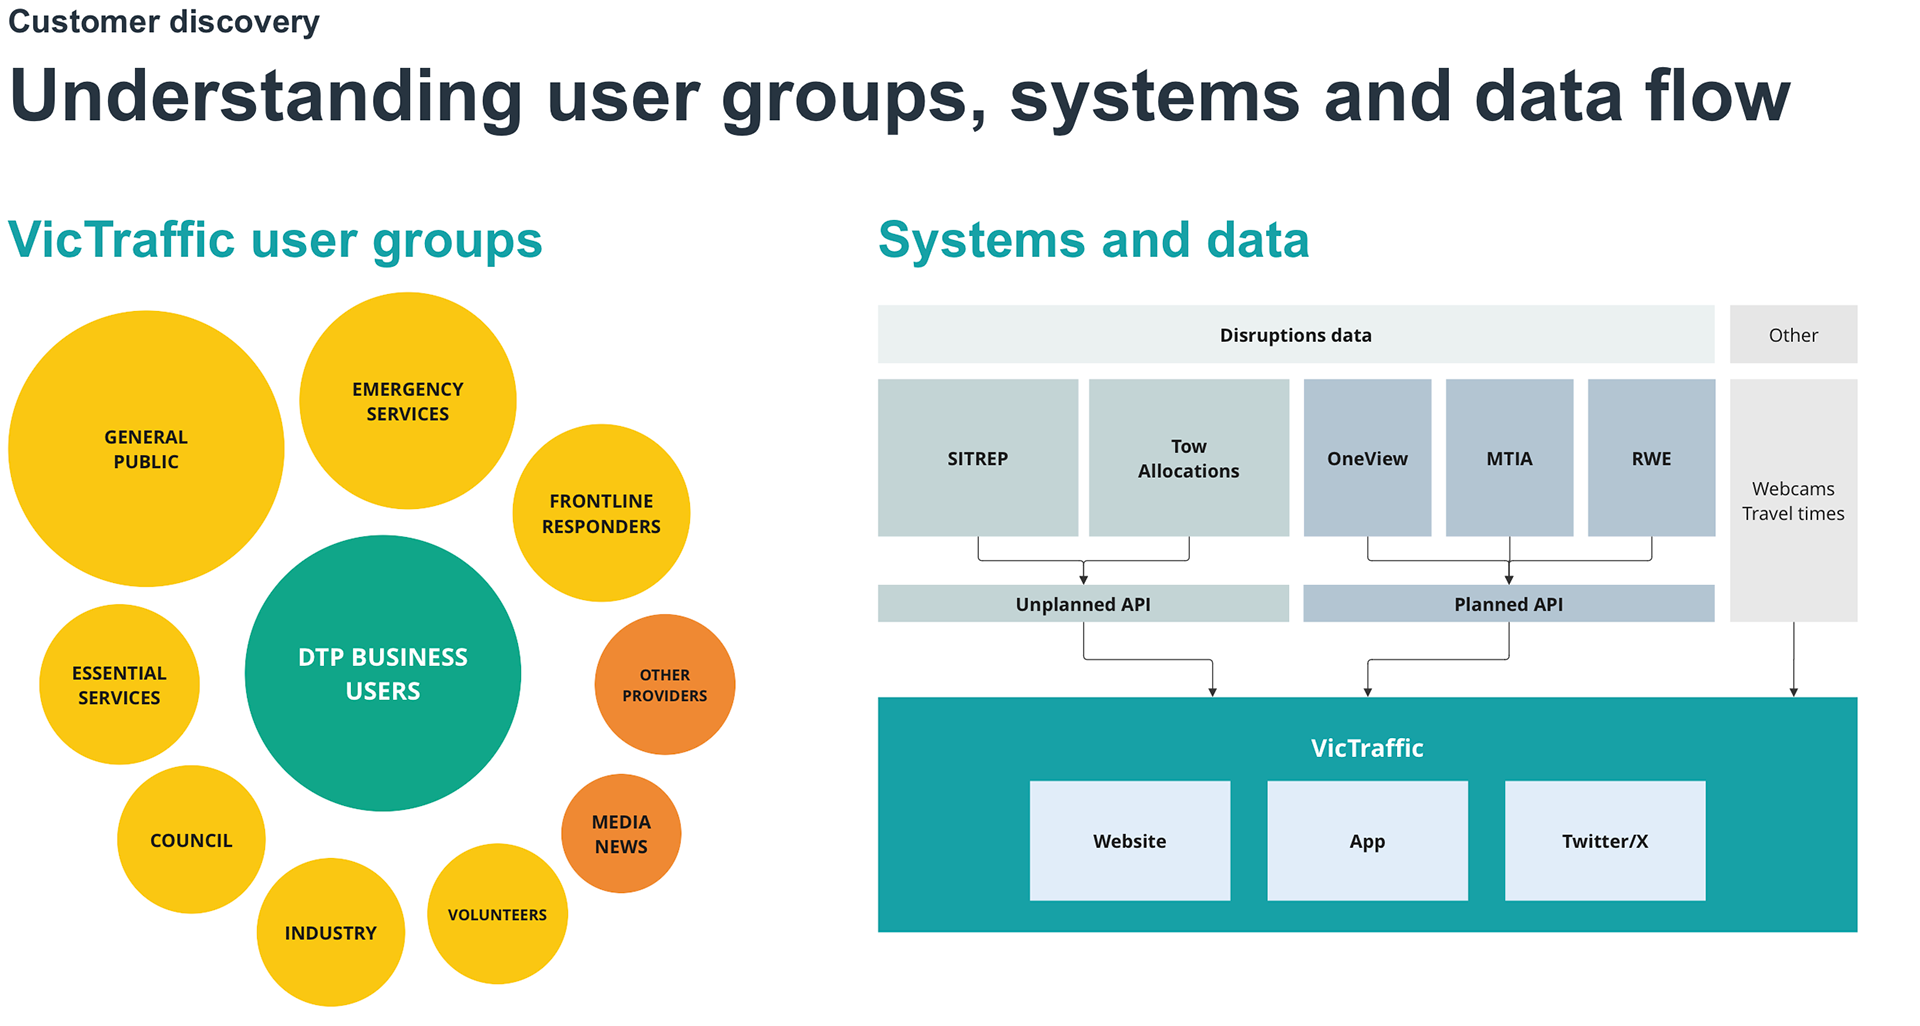
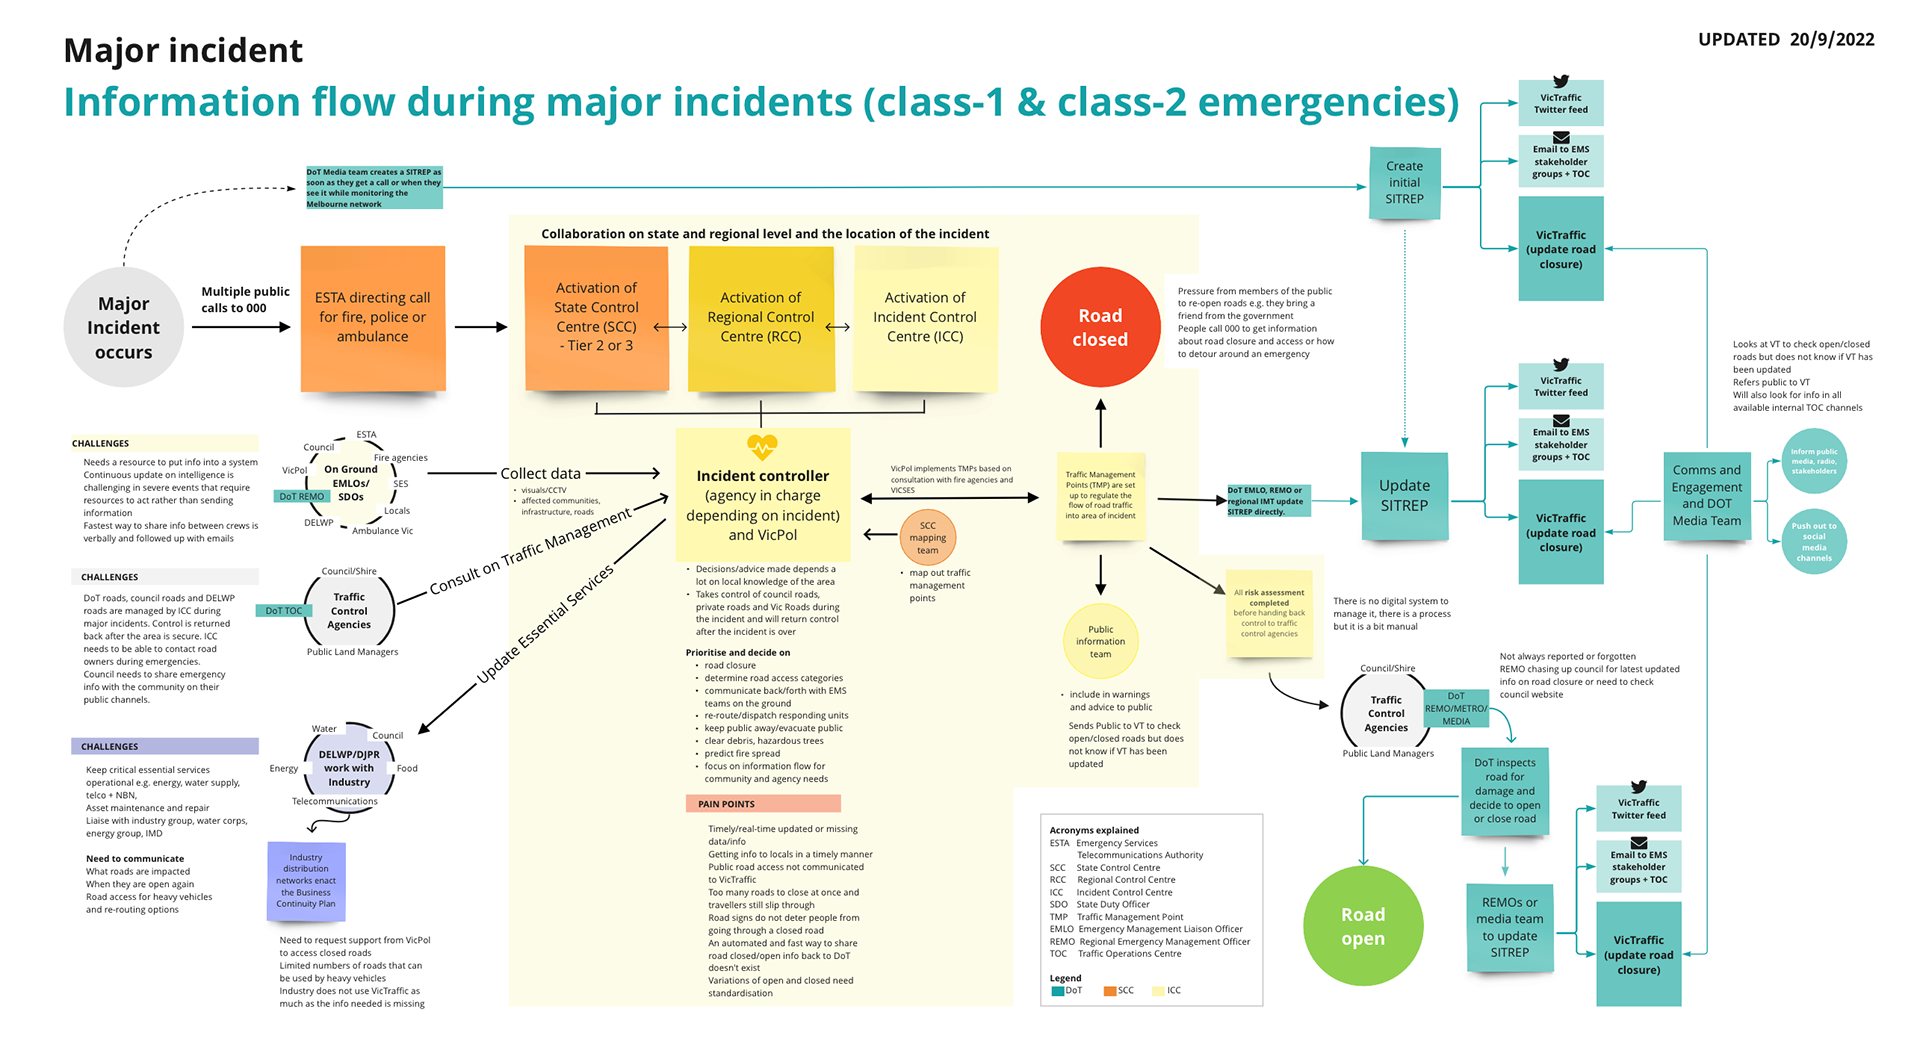
This is a diagram we created after speaking to emergency management services and DTP stakeholders. In this comprehensive diagram we captured the flow of information and associated challenges and pain points. It highlights a few things – all organisations that have a stake in the information flow, the lengthy and manual process of getting data on to VicTraffic, the need to communicate to other orgs and the public as as consistently as possible. The insights from the work with the general public and emergency management services provided valuable insights for the RID project team
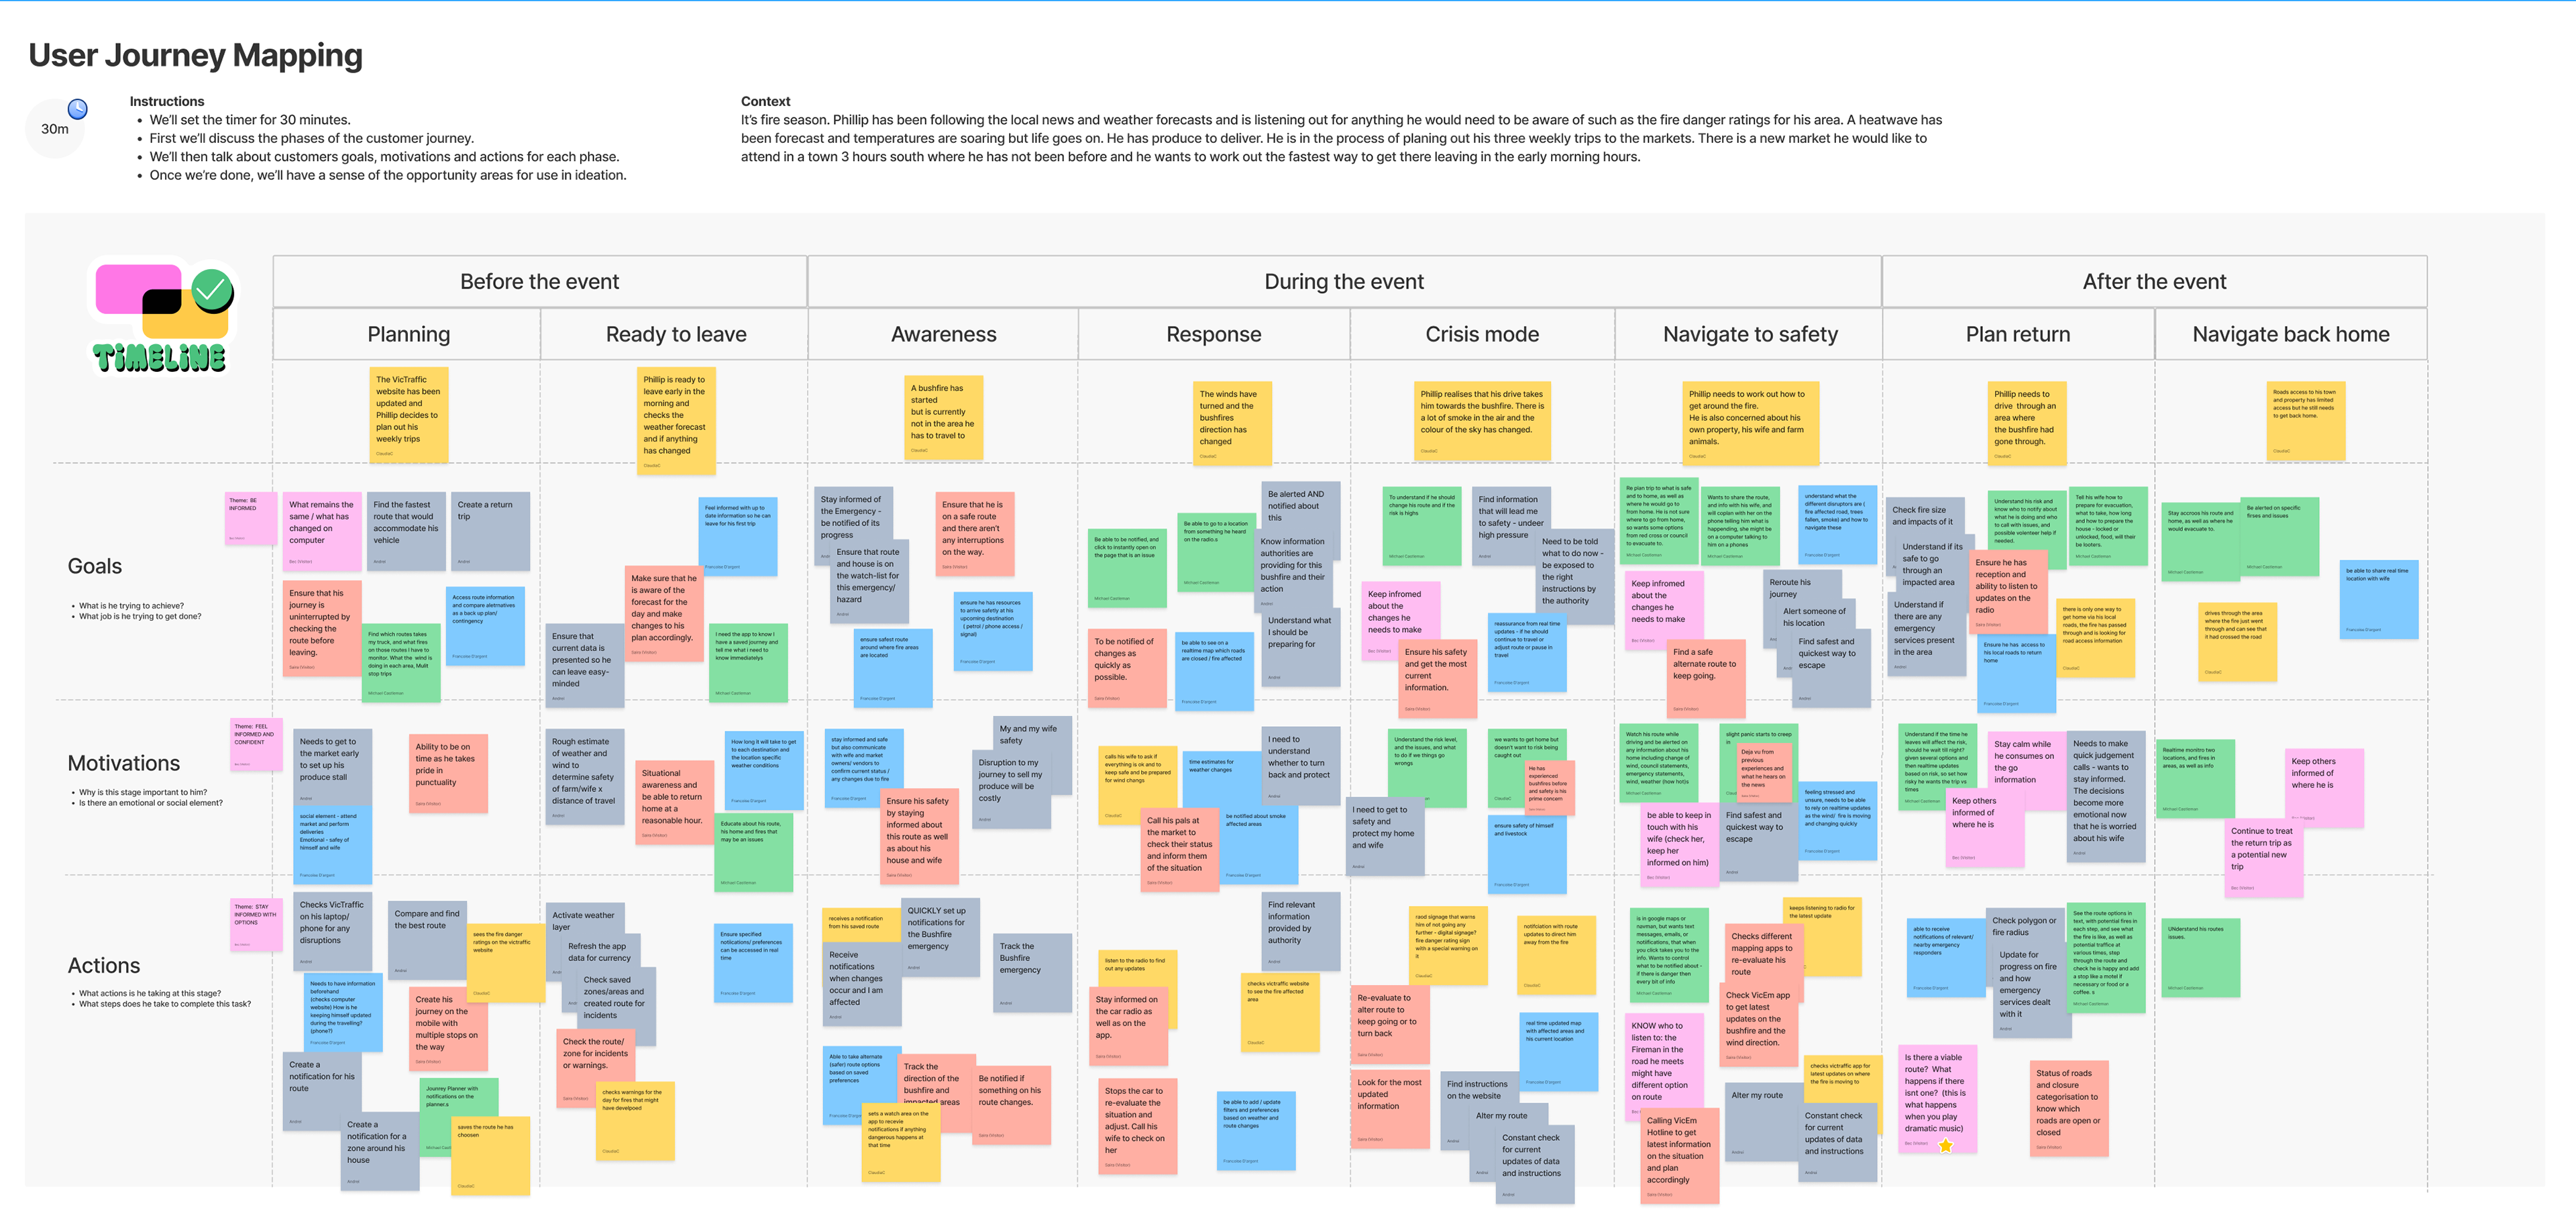
Journey mapping activity involving the project team and DTP stakeholders
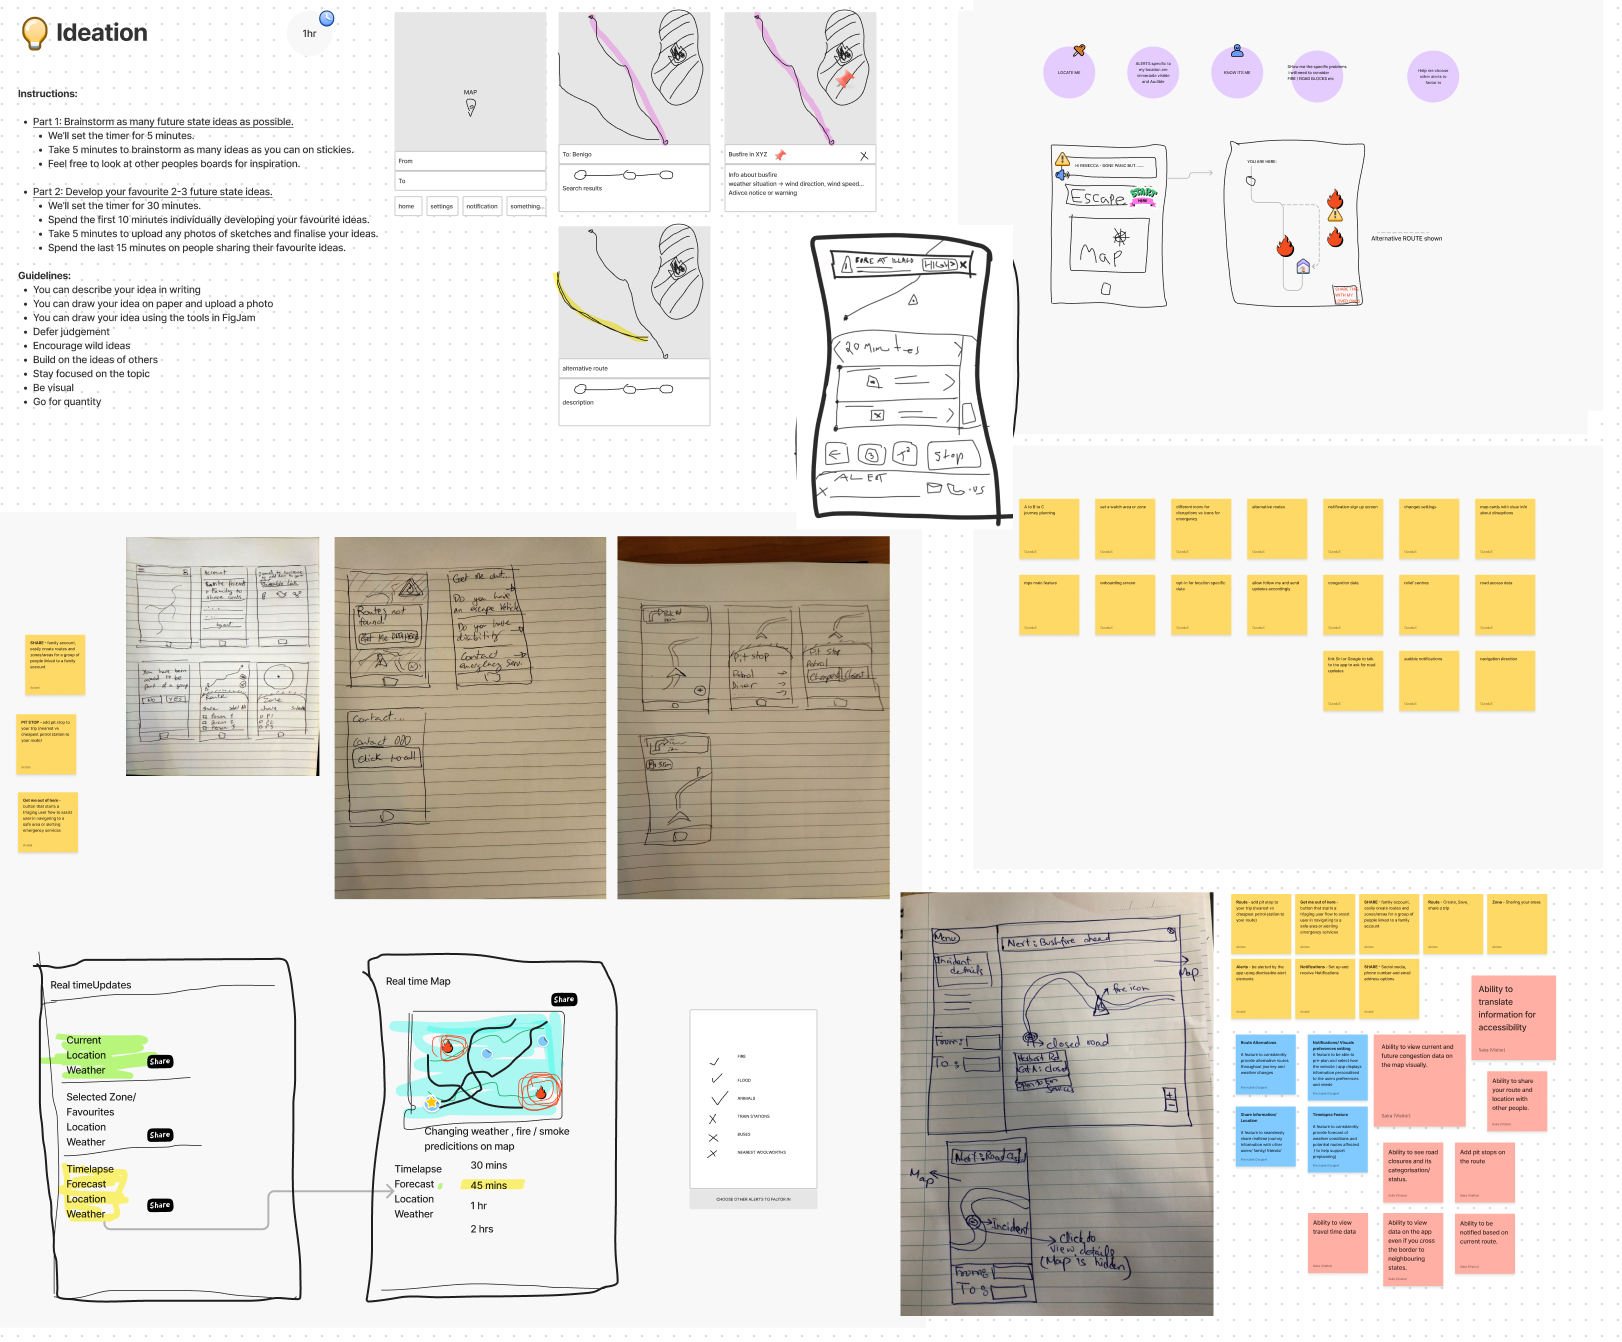
The co-design workshop with the project team helped to generate new ideas for how to best deliver the right data along all stages of the journey.
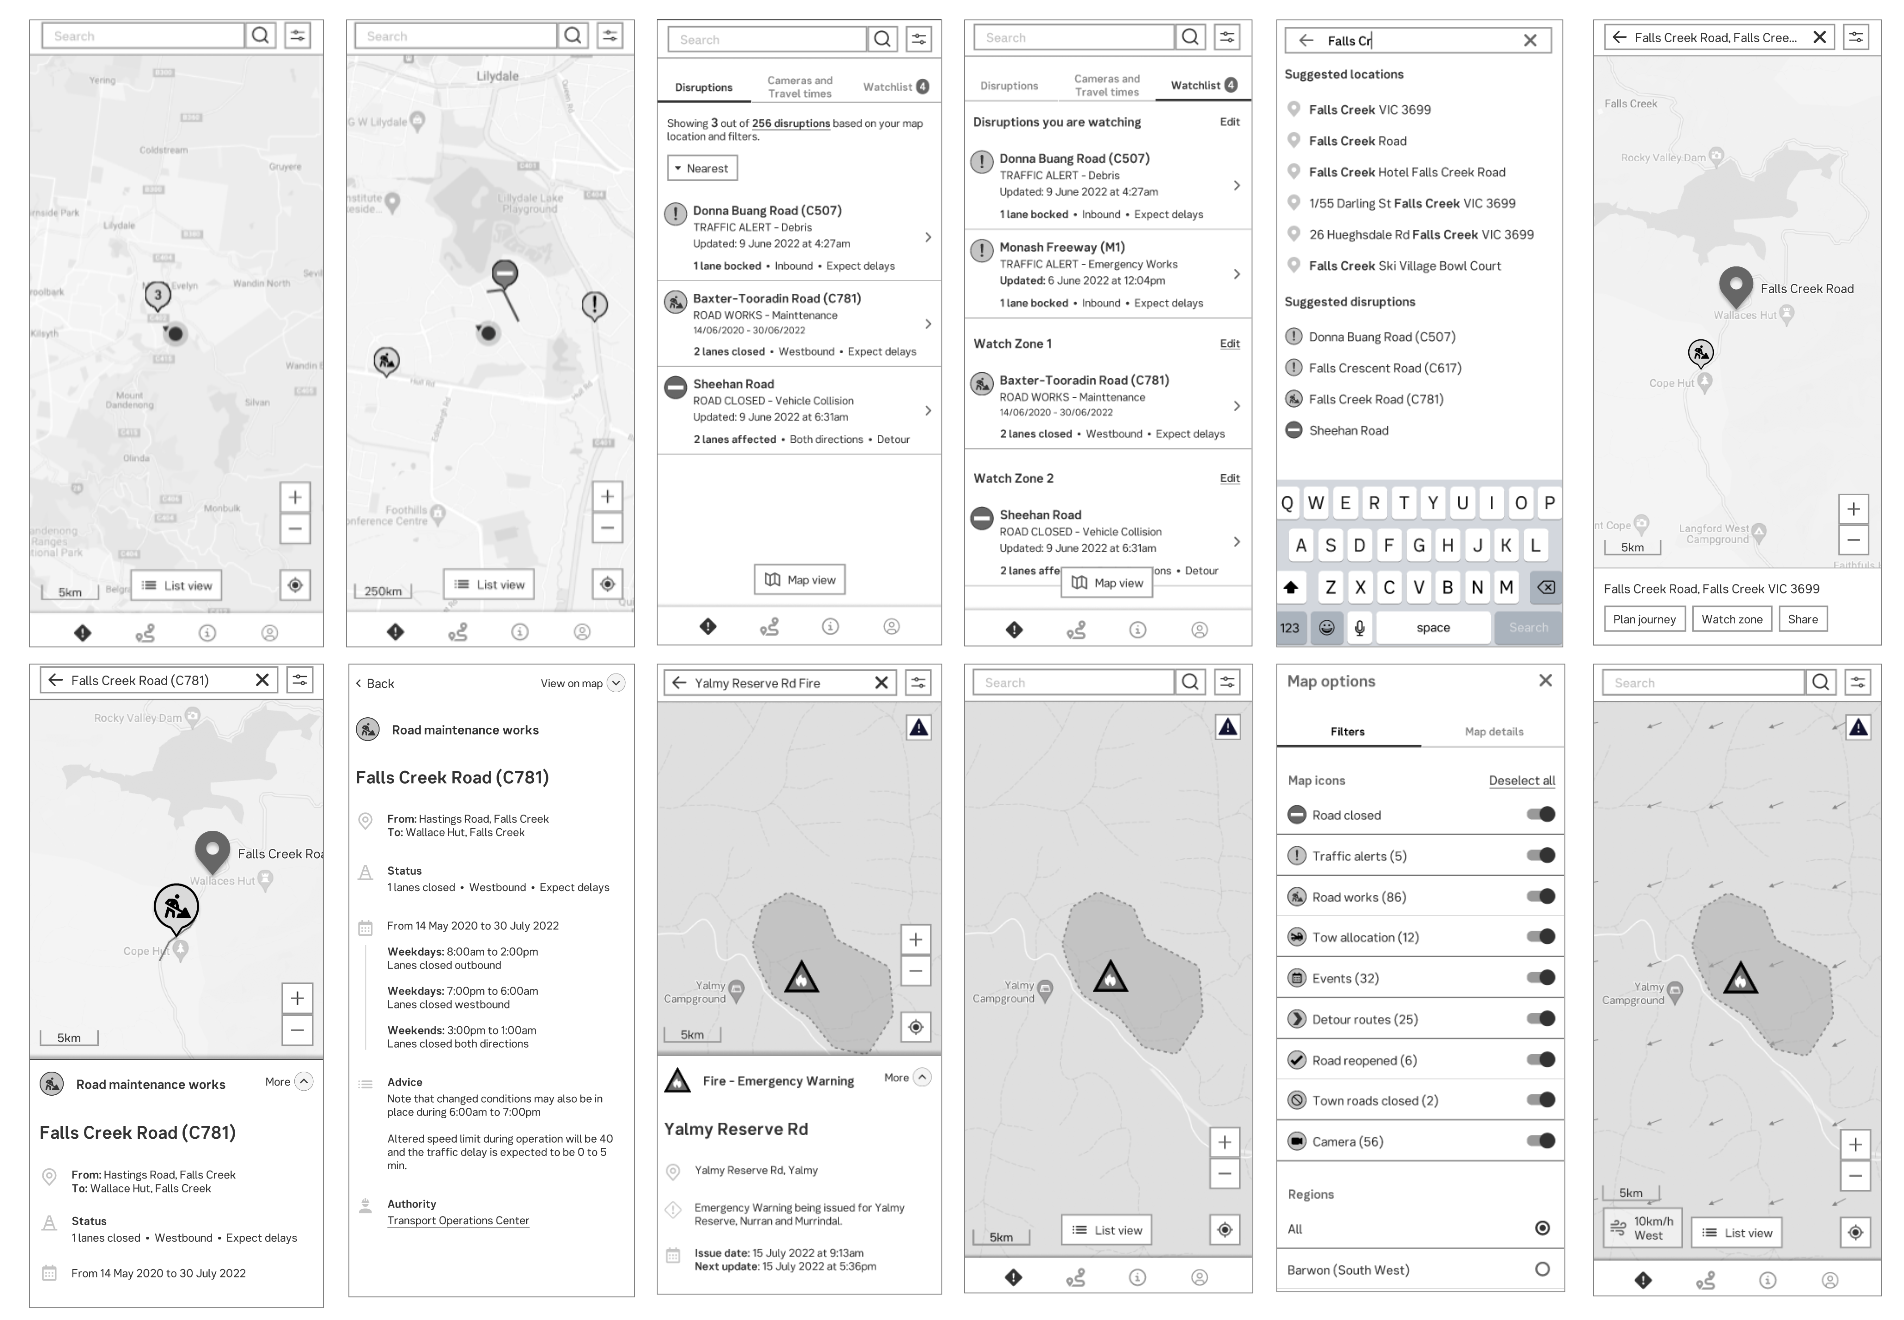
Mobile prototype from round 1 of feature testing - helping to identify and prioritise features for the product road map.